SAMMANTICS

  • Blog
  • About
  • Images
  • Research/Whitepapers
  • Stablecoin Surveys
  • Talks/Media

Dollar Weakening Could Propel Bitcoin to $300

March 24, 2015 by George Samman


The US Dollar, which has been in a massive uptrend since July 2014, has been sliding in recent days after last week’s Federal Reserve meeting.  It is now being assumed by market pundits that the Federal Reserve will hike interest rates later than expected. 

This has led to a correction within a major uptrend in the USD and has given life to Euro, gold, oil, and most other commodities.  Bitcoin r:  3, which has been lagging these other asset classes, may be able to follow if the dollar’s weakening continues. Of course, some more good newswould also help to counterbalance the recent slew of bad news.

The USD has broken a 30 year downtrend (see chart below) and is poised to go higher once this correction is over.  This is highly significant. The fact that a major downtrend has been reversed is something that should be paid attention to and respected. Therefore, one should not expect a major slide in USD.


However, there is still room for further downside as the chart below shows.  The USD has broken below its 20 day exponential moving average (EMA) and has support in two areas below, the 38.2% Fibonacci retracement line where it ended the day today and then the 50 day EMA at 95.96. If this fails, the correction should go to around the 94 area.


The negative correlations between the USD and commodities and all other foreign currencies remains intact. The chart below shows the last 10 days of price in USD, gold, oil, the Euro, and a commodity basket ($CRB). 

The USD peaked on March 16, which was the high of this move, notice what happens when USD starts to correct, all of these other asset classes have begun big countertrend moves. With further USD weakness this move should continue.


Below is a longer term (1 year chart) version of the same chart. The negative correlations remain very strong, which means the trend should continue as the relationship between USD and commodities and currencies should remain intact Relief rallies can be very powerful and sharp, one would expect this to be the case with most of these assets as they have been long downtrends.


Below is the bitcoin chart showing that BTC has not really participated in this relief rally caused by the dollar’s current weakening. There is hope though as bitcoin has remained above its short term bullish trendline.

Thus, as long as it remains above this trendline and breaks through strong short resistance at US$280 while the USD continues weakening, bitcoin has a good chance to test the short term closing high above the US$300 mark. 


March 24, 2015 /George Samman
Comment

Synereo Pioneers Attention Economy and Distributed Cloud to Deliver Next-Generation Social Networks

March 17, 2015 by George Samman


Synereo, a next generation decentralized and distributed social network, has released its whitepaper in which it reveals in great detail how the technology and network model work.

The introduction to the pioneering service, which CoinTelegraph was able to access in an exclusive preview, reads more like a “how to” manual in the spirit of open source rather than yet another social network manifesto.

The tech stack underlying Synereo has been in development for over 4 years and is already being used in existing commercial services. Combining the blockchain with an independent, self-tuning decentralized content delivery network (CDN) is an intriguing idea. The fact that the CDN has been in commercial use for two years quietly slipped under the radar of the cryptocurrency community.

Even more radical is Synereo's proposal that the Internet could achieve a higher order of self-organization through a kind of smart contract they call social contracts. The piece de resistance, however, is their attention economy model.

The unveiling coincides with Synereo’s crowdfunding campaign, where their AMP token, which plays a crucial role in the attention economy, will be sold. The crowdfunding campaign is set to be announced imminently.

Synereo has also launched a new “Learn More” section of its site, complete with a succinct overview of the major pieces in play, all with links to the whitepaper, to blog posts, and to presentations drilling deep into every subject.


The Opportunity

Synereo’s goal is to empower the users of its network by allowing them to retain ownership of their identity and the information they create – in stark contrast to the social networks currently in existence.

“There’s been a breach of trust. The information going into user feeds is being manipulated, and the information going out - including details of user activity outside of Facebook - is being handed over to governmental authorities; privacy settings be damned,” Dor Konforty, CEO of Synereo told CoinTelegraph.

Further, as there is no central entity endeavoring to profit from the network, value generated on the network stays in the hands of the users creating it.  

The whitepaper explains:

“… [I]n Synereo, our digital identity reverts to our control. We are free to construct it as we see fit and establish and utilize our reputation; it’s about our connections with others; about the communities we form; about the trust placed in us by our peers. Synereo, therefore, was not created only for reclaiming our financial value. It’s about reclaiming our social capital.”

The Attention Economy

Synereo’s attention economy approaches the management of information from the perspective of human attention being a scarce resource.

In our information age, information overload is a real and present issue. Synereo is attempting to manage information flow in the network using an approach inspired by economics, optimizing users’ ability to put their attention span to good use in a way that respects their time and reflects their preferences.

Dor Konforty, CEO of Synereo, thinks one of the big problems Synereo is solving is that our attention is mistreated and manipulated for the benefit of others.  There are very few solutions that assist in managing attention for people in their daily lives.

“Designing an attention economy is essentially about making people more effective agents through the careful management of their attention,” he explained.

“That means shaping both inputs and outputs of information in ways that reflect the user's own estimation of value. An efficient attention economy is one where users … are able to direct their attention in ways that effectively contribute to their projects, whatever they may be.”


Synereo considers the user’s need to feel in control of their presence on the network. Two of the tools that do this within the Synereo network are Reo and AMPs. Reo measures a user’s influence and reputation in a specific area of Synereo. By understanding how it moves and changes, the user gains an understanding of how their actions affect their own social space.

“That is what agency is about - and it's sorely lacking in current social networks,” Konforty adds.

The AMP is Synereo’s information flow currency, and its purpose is to “AMPlify” the ability of a user’s content to spread throughout their network and increase the chances of it being seen by more users. This is done by increasing its so-called “Current”, a measure of the power of messages flowing through the network.

Social Contracts

Social contracts are a smart contracting system that does not rely on global consensus – or ablockchain at all. They are powered by a mathematical model that's been tried and tested for many years and that is a result of decades of research.

Social contracts are enforceable statements which will be made independently and autonomously, yet can be assembled to determine and define the information policy flow policy of a collective. Konforty believes Synereo’s smart contracting system is superior to anything currently on the market. Among other advantages, the approach allows Synereo to sidestep the halting problem rather than attempt to circumvent it through a gas token, a-la Ethereum.

This post on Synereo’s blog goes into great technical detail about this innovative way to implement smart contracts.


The DendroNet

Synereo forgoes use of the Blockchain in favor of a “DendroNet”, Synereo’s local consensus-keeping mechanism, decentralized ledger, and distributed content model. Every user on Synereo has their own fraction of it - a “Dendrite”, allowing them to view the part of the network relevant to them.

A user’s Dendrite is constantly updated with information received from peers: social information from friends; meta-data and keys to encrypted data hosted on Synereo’s distributed cloud storage mechanism; and information saved on their Dendrite itself, used in the consensus-keeping process.

The whole mechanism is based on SpecialK, Synereo’s distributed cloud - the foundation upon which the Synereo network is built. In part, it is an evolution of the distributed hash-table (DHT) concept, famous for its use in the BitTorrent protocol. This blog post goes into the reasoning behind its creation.


The Mission

Synereo seems to be the logical next step in the evolution of social media. The conclusion from the Synereo’s executive summary neatly sums up its long-term aspirations:

“With the rise of the social media, we seem to have forgotten that what makes us strong is our ability to work together, side-by-side, while remaining responsible to ourselves as individuals.

“Privacy and autonomy are cornerstones of democratic society. This was the spirit of thetechnology that made the original Internet protocols and the World Wide Web. This is the spirit that is on the move again in the renewed interest in decentralized and distributed technologies.”

Check out Synereo’s website here for the latest news and to sign up for updates.


March 17, 2015 /George Samman
Comment

This is the Most Important Chart for the Global Economy

March 10, 2015 by George Samman


Every major global currency is down against the US dollar for the past 200 days. This has been intentionally engineered by central banks and governments in order to stimulate their weak economies by devaluing their currencies in order to become competitive in global trade. 


The Almighty Dollar

As has been talked about for many months in previous articles, the USD has been the key driver of the global economic situation. Below is a chart of the USD versus all major currencies over the last 200 days. Notice they are all down at least 8%. The euro continues to move towards decreasing parity with the USD and is down near 4% already in March alone. Bond yields throughout Europe continue to drop and in many countries there are negative interest ratesalready.


Currency devaluation occurs to make exports cheaper and more attractive to foreign buyers, while at the same time driving up import prices. This is done to discourage domestic consumers from purchasing foreign goods and instead buy goods from their own country.  But with all major currencies doing it at the same time it has become a race to the bottom.

Right now the Euro is “winning” with its rate at a 12 year low, and and with the launch of QE that trend should remain in place. 


In a recent Bloomberg article, Gary Shilling states this is a big problem for the US who had enjoyed the benefits of a weak dollar during its massive QE program. Shilling notes:

“But the Fed faces a dilemma: As other countries devalue against the greenback, the U.S. can't purposely knock down the dollar. As the world’s reserve currency, what could it be devalued against? A stronger dollar makes U.S. imports cheaper, which forces domestic producers to stay competitive by lowering prices and laying off employees to cut costs. A rising buck, then, works against the Fed’s goal of price stability and full employment.”

But now with the US economy in recovery and speculation of interest rates being raised very soon, the USD has surged to levels not seen since 2004, as the chart below shows.


As shown on the chart, the USD has blown through major resistance levels going back 20 years accompanied by the 50 month EMA (exponential moving average) crossover of the 100 month EMA. A major trend has reversed (USD in decline) and it appears that this is the early stages of a much bigger uptrend.

This will continue to put enormous pressure on the entire commodities complex as well since commodities are priced in USD. Below is a chart comparing the USD vs. CRB (which is a commodity index and holds most major commodities).


The other elephant in the room: The Yuan

China is trying to loosen monetary policy (2nd rate cut in 3 months) as the USD is surging. China is increasingly impacted by the Fed's policies as a result of two things: weaker currencies around the globe, coupled with China's quasi-peg to the USD, which over the past week has soared to fresh 13 year highs on expectations that the Fed will hike this summer.

This is having a negative impact on the profit margins of Chinese domestic companies and is in conflict with tightening monetary policy. Deflationary forces are at China’s doorstep, and this may mean the yuan will need to devalue, and quite possibly de-peg.


Bitcoin has also suffered from the surging USD, and as long as the uptrend remains in place this should continue to put downward pressure on the bitcoin price.


The most important chart in the world

From all of the data presented, the USD chart is the most important chart in the world right now, and as significant resistance levels are broken, more pressure will be felt by all the aforementioned central banks and governments.

How they will respond is still unknown, but it’s not setting up to be a friendly global macro environment. Call it what you want (devaluation, manipulation, or “currency war”), but the self interest of each country and its domestic citizenry are setting the ground for the next phase, and it is apparent that every country wants to cheapen their currency to gain a competitive edge against other countries.

But in the meantime, all eyes on the US dollar chart. 

March 10, 2015 /George Samman
Comment

Miles Kimball on negative interest rates and when robots will set monetary policy

March 07, 2015 by George Samman


Miles Kimball, who is a Professor of Economics and Survey Research at the University of Michigan tells CoinTelegraph about negative interest rates, the future of paper and electronic money, and how cryptocurrrency fits in.

Negative interest rates are a recent topic garnering much attention in the economic world. In no particular order, Denmark, Switzerland, Germany, Netherlands, Germany, Austria, and Sweden have or have recently had negative interest rates. On top of that some corporate bonds have had negative interest rates as well like Nestle and Shell.

What are Negative Interest Rates

Negative interest rates are when you give the bank or government some form of money, and over time that bank or government will give you back less money than you initially deposited.

Essentially, you are paying a bank or government to take care of your money. This is the result of a flight to safety for people who are extremely risk averse, and it generally happens coming out of a massive recession in places where there is little to no growth (e.g. the EU).


GSS: Why is it easier to have negative interest rates with electronic money vs paper? Also can you explain how this would work with a currency like bitcoin vs. "electronic dollars"?

Miles Kimball: It is easy to have negative interest rates for money in the bank: the number for the balance in the account gradually goes down if nothing is put in or taken out. Because paper money has a particular number written on it, getting a negative or positive interest rate for papercurrency requires a little more engineering. And that engineering involves having the e-dollar be the unit of account.

If the paper dollar were the unit of account, then the interest rate for paper currency is always zero (unless you have a system of directly taxing paper currency, which is administratively burdensome and politically much more difficult than an electronic money system). So to have negative interest rates on paper currency as well as in other assets, the e-dollar needs to be the unit of account.

“[I]t is fine to have private cryptocurrencies perform the medium-of-exchange and store-of-value functions of money […].”

With the e-dollar as the unit of account, everything the central bank needs to do to have a nonzero paper currency interest rate can be done at the central bank's cash window where banks come to deposit or withdraw paper currency from the central bank. 

For good monetary policy, it is important that the central bank have control over the unit of account. And this e-dollar unit of account might have many of the aspects of a cryptocurrency--perhaps enough that it can be considered a cryptocurrency.

As far as private cryptocurrencies (like bitcoin) go, it is fine to have private cryptocurrencies perform the medium-of-exchange and store-of-value functions of money, but monetary policy requires control over the unit of account. So central banks need to retain control over the type of money that defines the unit of account--in this case the e-dollar.

Under an electronic money policy, 3 key things will insure that the e-dollar (or e-euro or e-yen or e-pound etc.) is the unit of account: 

  • a requirement that taxes be calculated in e-dollars. 
  • accounting standards that require accounting to be done in e-dollars.
  • the kind of need for coordination between businesses and between businesses and households that leads people to do daylight savings time (without any intrusive inspections of someone coming to look at your clocks).  

“To have negative interest rates in a cryptocurrency system […] there should be a separation between the unit of account and the medium of exchange.”

GSS: How can you have negative interest rates in a cryptocurrency system?

MK: To have negative interest rates in a cryptocurrency system that uses bitcoin, say, for most transactions, there should be a separation between the unit of account and the medium of exchange.

Having an e-dollar that is distinct from a bitcoin is the way to do this. (Also, it is good to have many different stores of value. But that always happens.)

Currently, robots cannot do monetary policy as well as central banks can. Someday maybe they will be able to. Then a robot can be put in charge of the e-dollar. But there would still need to be a separation between the e-dollar unit of account (controlled by a robot) and anything that mechanically has a zero interest rate stated in terms of itself (as bitcoin now does). 

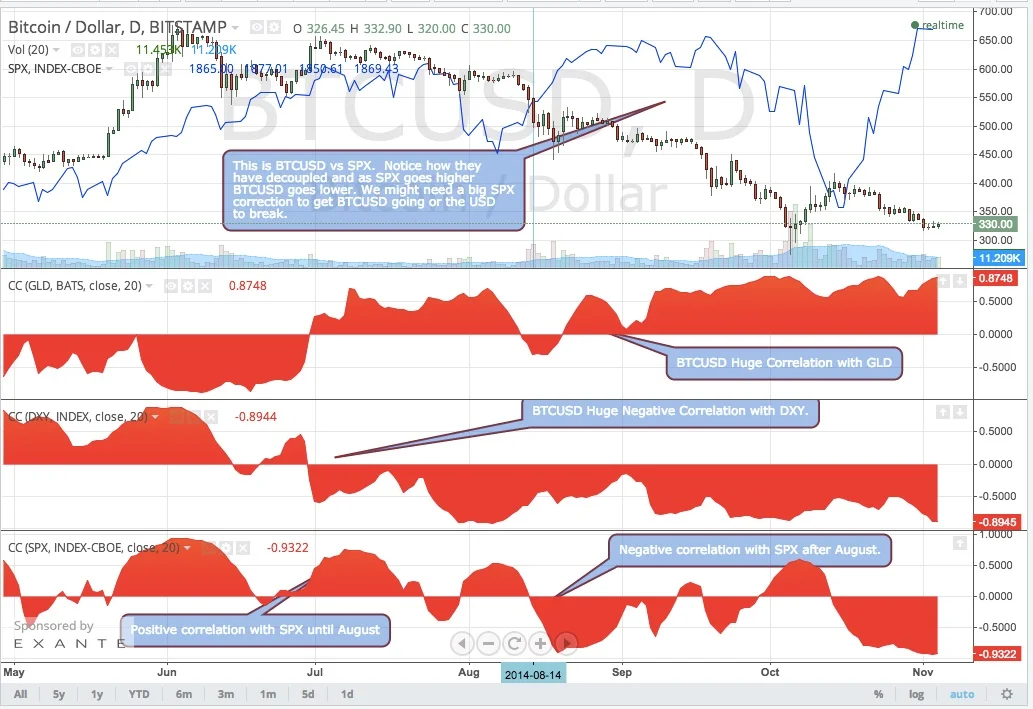
GSS: What are your thoughts on bitcoins ability to be a currency?  What are its limits from your perspective?

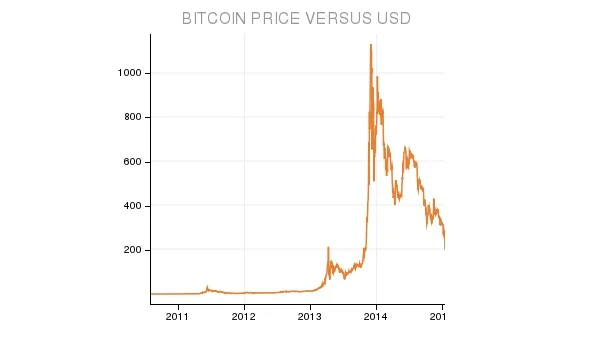
MK: Bitcoin is a currency already. But it would not be good to try to use it as a "full-service" currency. A good unit of account needs to have a constant value relative to goods and services. Bitcoin does not do this. And it cannot keep a constant value relative to goods and services without a much, much, more sophisticated algorithm for controlling the supply of bitcoins that would rival in complexity (and exceed in quality) what central banks now do. Good monetary policy is not easy.

“Central banks (which are humans assisted by computers) still do a much, much better job at monetary policy than the bitcoin algorithm would.” 

The unit of account should be under the control of the institution that does the best job at keeping the value of the unit account constantly relative to goods and services--and in the process, keeps the economy at its natural level of output.

Currently, that is central banks. Bitcoin's value fluctuates wildly relative to goods and services. Central banks (which are humans assisted by computers) still do a much, much better job at monetary policy than the bitcoin algorithm would. 

GSS: Also if you could talk more about blockchain technology and central banks? What type of tools/operations would be best suited for a blockchain?

MK: I am not a technical expert on blockchains, but I think blockchains or technical advances inspired by blockchains will be important in making e-dollars work as well as possible. Electronic dollars include money in the bank, but its being done in a very inefficient way, and transaction costs are huge, banks need to go the way of bitcoin. Blockchain technology is a great advance because it can do it much more cheaply than how the current banking system handles transactions now. It will make electronic transactions will be much more meaningful.

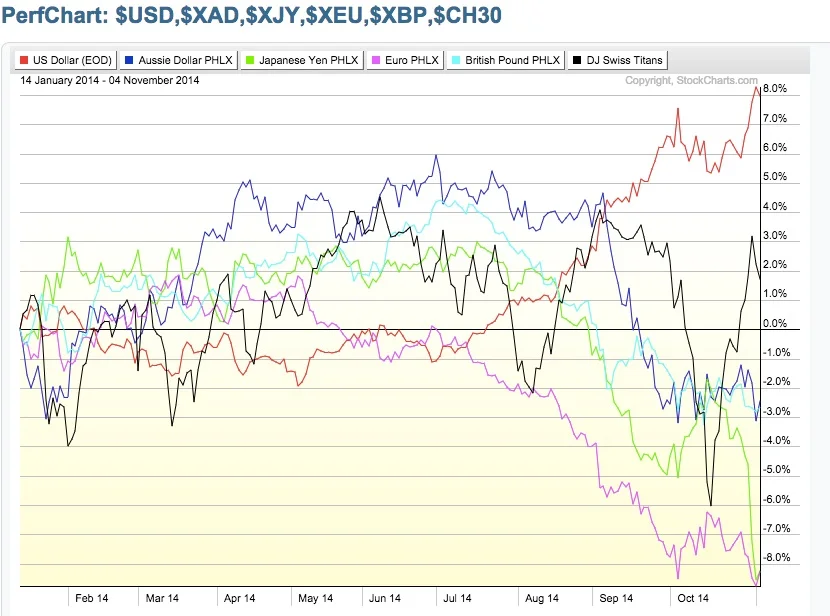
GSS: Do you have any thoughts on the "currency wars" and their impact on central bank policies? Do negative interest rates have anything to do with this?

MK: Talk of "currency wars" is mostly silly. If all countries do expansionary monetary policy, that is not a currency war, that is a global monetary expansion not a currency war. If every time you read about a "currency war,” you substituted the words "global monetary expansion," you would not go far wrong. 

The only case when the word "currency war" is justified is when countries are each doing currency interventions by selling their own assets and buying equivalent foreign assets. If all countries do this, it all cancels out, and things are back to square one.  

As long as each country or its central bank is purchasing assets that have a higher interest rate or rate of return than the assets they are selling, it is a monetary expansion, not a salvo in acurrency war. 

Of course, monetary expansions have an effect on exchange rates, but if another country is not happy with that effect on its exchange rate, it should just match with its own, appropriately calibrated monetary expansion. That response is not a response in a "currency war," it is normal monetary policy. 

“[B]eing able to do negative interest rates makes it possible to nip recessions in the bud.”


GSS: Can you say what incentivizes central banks to have negative interest rates?

MK: The job of central banks is to keep keep prices stable and to keep the economy on an even keel by keeping output at the natural level. Doing both of these jobs well requires at least occasional use of negative interest rates.

As it is, the Fed, the ECB, the Bank of England, and now the Bank of Japan have a long-run inflation target of 2% because they haven't yet put negative paper currency interest rates in their toolkit. Being prepared to do negative interest rates allows the inflation target to be reduced to 0--true price stability.

And being able to do negative interest rates makes it possible to nip recessions in the bud. These are big enough advantages that I think the eventually most central banks will indeed put negative (and positive) paper currency interest rates in their toolkit.  

Miles Kimball is an expert on negative interest rates as well as paper money vs. electronic money, and is a major proponent of electronic money. He writes on his own blog discussing e-money as well as other economic themes.

March 07, 2015 /George Samman
Comment

Ukraine’s 272% Hyperinflation Rate Boosts Bitcoin’s Prospects in Eastern Europe

March 03, 2015 by George Samman


Ukraine is currently experiencing the worst period of hyperinflation in the world as the government has imposed capital controls to stop its citizens from dumping the Hryvnia. This can potentially make cryptocurrencies the only viable safe haven for the embattled country’s population. 

“Yesterday a 62 year old man managed to get back his money from the bank (after 3 month of persistent attempts) and came to buy bitcoins. He does not trust the state nor the bank and is willing to take the risk of bitcoin volatility.”

-Michael Chobanian, the BitcoinCT r:  3 Embassy of Ukraine founder

Trouble in Ukraine

The situation in the Ukraine has gone from bad to worse.  When a country passes Venezuela as the most inflationary place on the planet, things aren’t going so well.  According to government statistics, the official headline number on inflation is 28.5% year over year. However, Professor Steve Hanke of the Cato Institute disputes this:

“Using this figure and black-market exchange rate data that the Johns Hopkins-Cato Institute for Troubled Currencies Project has collected over the past year; I estimate Ukraine’s current annual inflation rate to be 272 percent – and its monthly inflation rate to be 64.5 percent. This rate exceeds the 50 percent per month threshold required to qualify for hyperinflation. So, if Ukraine sustains its current monthly rate of inflation for several more months, it will enter the record books as the world’s 57th hyperinflation episode.“


Apparently the Ukrainian government has completely under reported the numbers to further its own agenda to avoid mass panic. Sound familiar? Unfortunately, it is bit too late for that as the Ukrainian currency, the hyrvnia, has dropped 70% since the beginning of 2014. 


In previous articles, the causes of hyperinflation have been defined.  In the case of Ukraine, it has been caused by systemic corruption, a war with its pro-Russian secessionist eastern regions, which has destroyed a lot of its factories and caused the country to lose a quarter of its industrial capacity. This resulted in a huge output gap and a rapid increase in the money supply to helpfinance its ongoing war.

Russia is also its largest trading partner so that does not help matters.  Ukraine is running massive deficits and as no revenue coming in, the beleaguered nation is on the brink of default.

Capital controls

The government has attempted to fix the exchange rate in an attempt to quell the panic and a run on the banks.  This has led to Ukraine’s minimum wage to be approximately US$42.90 per month, which puts it lower than Ghana or Zambia, the RIA reports.  This has led to what resembles typical hyperinflation:

"Food prices among producers rose 57.1 percent, with the price for grains and vegetables rising 91 percent from January 2014 to January 2015, while the official inflation rate over the period totaled 28.5 percent. Meanwhile, Ukrainian consumers responded to economic difficulties by cutting their spending in hryvnias by 22.6 percent, which amounts to an almost 40 percent decrease in real consumption."

This rapid rise in inflation and collapse in the currency has led Ukrainian President Poroshenko to take extreme actions and to tighten capital controls even more, which the government has sincedialed back slightly.

When the Hyrvnia was in free fall Wednesday February 25, the central bank banned banks from buying currency on behalf of their clients for the rest of the week.  This was later repealed but it is still near impossible to exchange currency at the banks.  In February alone, this has led to a massive spike in the USD/UAH rate as the US dollar continues to surge as people are looking for safe havens.


“Even though officially the foreign exchange limit is 3,000 UAH (hrynvias) per day you still can’t buy or sell foreign currency in the bank,” said the founder the Kuna Bitcoin Agency and TheBitcoin Embassy of Ukraine, Michael Chobanian to CoinTelegraph. “They will not sell you any. So there is practically no liquidity.”

He added:

“Exchange still works but huge obstacles have been put up. It will take a minimum of 4 days if you want to buy USD (for a company or an importer). The average person does not have access to interbank exchange.”

This has led to massive growth in the underground economy.  The IMF estimates that Ukraine's underground—and non-tax-paying—economy is as much as 50 percent of GDP. This has only compounded Ukraine’s problems as government revenues have declined massively.

Exchange kiosks on the streets in Kiev were selling limited amounts of dollars for 39 hryvnias - around 20 percent higher than the rates advertised in the windows of commercial banks where dollars were not available. 

Even regular citizens in the country are increasingly turning to bitcoin as a safe haven according to Chobanian, who explained:

“[N]owadays I have clients who aren’t even tech savvy looking to buy bitcoin. Yesterday a 62 year old man managed to get back his money from the bank (after 3 month of persistent attempts) and came to buy bitcoins. He does not trust the state nor the bank and is willing to take the risk of bitcoin volatility. The old man said ‘with bitcoin I am sure that I will always get at least something. With the bank I almost lost everything.’”

As is always the case in hyperinflationary episodes, people are trying to get rid of hyrvnia as soon as they get them since they will be worth less tomorrow. The price of gold has also spiked in UAH terms:


Bitcoin on the Rise

In countries with persistently high inflation rates, such as Argentina and now Ukraine, bitcoin has a real use case.  Particularly, when capital controls are introduced making it almost impossible to access other currencies and asset classes. 

For high net worth individuals in these countries, there are ways to trade hard assets like real estate and precious metals for bitcoin, which can easily be sold during hyperinflation as the local currency devalues rapidly. This allows you to bypass banks and capital controls, but the problem remains for the rest of citizenship and how they can get bitcoin without having to trade their worthless fiat into something else just to get bitcoin. 

Unsurprisingly, Ukraine’s government issued a warning against cryptocurrencies back in November, 2014. However, this has not disrupted the operations of Bitcoin businesses in the country. “The announcement does not affect my business in any way,” Chobanian told CoinTelegraph back in November.  “This is a simple runaround. Based on the contents, it’s clear that the NBU (National Bank of Urkaine) does not understanding the situation.”

Meanwhile, the price on LocalBitcoins in Ukraine has reach an asking price of as high as ~US$413.65 (10,947.19 UAH) per bitcoin - nearly double the market price – pointing to considerable demand for the cryptocurrency, which may also be partially responsible for the latest price increase.

Thus, a real opportunity exists for both cryptocurrency and Ukraine’s citizens who are trying to dump worthless fiat that no one wants in exchange for bitcoin.

And while friction undoubtedly exists, this may be a perfect time not onlyfor cryptocurrency to flex its muscles in the embattled country, but also for Bitcoin businesses and exchanges like Kuna Bitcoin agency, who may offer the only viable option to retain people’s savings. 

March 03, 2015 /George Samman
Comment

Currency Wars, Commodities, & Deflation

February 08, 2015 by George Samman


To say these are unprecedented times is an understatement. Global Central Banks are using every single monetary policy tool at their disposal to try and fight the forces of deflation and this has resulted in currency wars. In fact, 15 central banks have eased monetary policy in one way or another this year. Since this is a global economy each move made has far reaching affects upon all nations and their abilities to control the imbalances being caused by central bank brute force.

The term currency war gained prominence in 2010 when Guido Mantega, Brazil’s Finance Minister, complained that quantitative easing (QE) was weakening the US Dollar and prompting other countries to respond so they wouldn’t lose their export competiveness. This led to a “race to the bottom” in which all countries were engaged in trying to weaken their own currencies as much and as quickly as possible. Fast forward to today, as the chart below shows, and the opposite situation holds true. The USD has strengthened dramatically since 2011 and is sitting at decade highs. The biggest part of the move has come since the summer of 2014.


What is interesting though is that since the USD bottomed in 2011, all other currencies - as well as most other commodities - spiked. Below is a chart of the Australian Dollar which illustrates this perfectly, as it peaked out in 2011 and has been dropping ever since. The Australian Dollar is known as a risk on trade because it is tied heavily to commodities and China. The inverse relationship between the USD and commodities, along with China’s growth slowing, has hurt. In an effort to stimulate the economy, the Reserve Bank of Australia (RBA), Australia’s central bank, cut interest rates for the first time in 18 months. All the way to the right on the chart, you can see the Australian Dollar move lower as a result of this move.


The Canadian Dollar has had a similar move as well, and topped in 2011. Canada is heavily tied to the energy sector, as it is one of the largest energy producers in the world. Canada also had an emergency rate cut a few weeks back.


The state of affairs of Europe and Japan have been talked about ad nauseum, and makes it needless to say that they are both trying to stave off deflation while stimulating growth in their respective economies. The European Central Bank (ECB) and the Bank of Japan (BOJ) are both actively engaged in QE. Below are the charts of both the Euro and the Yen.


Europe, Japan, and Australia are examples of countries using currency devaluation as a monetary policy tool to stimulate growth. With interest rates in the developed world at near zero, or even in some cases negative, this makes borrowing costs for the corporate sector almost nothing. It is also causing asset prices to rise since savers are being punished and are moving into riskier asset classes in search of higher yield. Monetary stimulus allows central banks to export deflation to other parts of the world. The Danish Kroner is pegged to the Euro and as a result has had to cut interest rates 3 times in the last 2 weeks due to a falling Euro, caused by the announcement of QE. This relationship is probably doomed to failure. The Swiss National Bank (SNB) learned its lesson the hard way and had to de-peg as it was becoming too costly with the sinking Euro to maintain the peg and continue buying Euros. The move has hurt the Euro and caused ripples all over the world as it was unanticipated by global markets. Below is a chart of the Swiss Franc. The peg started in September 2011 and ended in January. This is an extraordinary move in currency.


China has also joined the party and cut interest rates but it may have a bigger problem which is the loose peg it has to the USD currently, when the USD is surging and China is trying to loosen monetary policy. The trade weighted exchange rate has jumped 10% since July. This is having a negative impact on the profit margins of Chinese domestic companies, and caused issue with tightening monetary policy. Deflationary forces are at China’s doorstep, and this may mean the yuan will need to devalue, and quite possibly de-peg.


All of these moves by central banks have caused huge amounts of volatility in the Foreign Exchange (FX) market. This is problematic because higher FX volatility makes hedging more expensive for companies and discourages foreign direct investment. Essentially, it causes countries to focus internally and hurts global growth, which we are starting to see happen.

Being that the US has ended QE (for now) and indicated it will raise interest rates at some point this year, coupled with what is perceived to be a strong domestic economy, the USD has strengthened and investment has flowed to the US. As has been written before in The Drumbeat of Deflation, the USD and commodities have had a negative correlation, where as the USD goes up, commodities go down, and vice versa. Commodities are down dramatically since 2011, where they peaked and they continue to fall, which is very deflationary. Below are 2 charts of commodity prices. One of them is from 2011 until now, and the other the last 365 days. With the exception of gold, the fall in most commodities has been precipitous.


This should not be happening in a global economic recovery. What is even more perplexing is the yield on the 10 year bond. It has been falling and is near record lows. The bond market does not believe the recovery story and is worried about deflation as capital flows have moved into bondsand the USD. These are NOT signs of recovery. Below is chart of the 10 year bond yield:


The 30 Year yield is at a record low:


The world has been in a deflationary state since 2001, and the cause of this deflation has been the bursting stock market bubbles (Asian Crisis of 1997, Dotcom 2000, Great Recession 2008, and now possibly the currency wars). This has all led to competitive devaluations through central bank tools to try and stimulate respective economies, which has led to more deflation in a vicious cycle that has become a negative feedback loop. Deflation creates a loss of pricing power, a downward trend in prices, an erosion of profits, and an excess capacity, particularly in developing countries with low cost factories and huge new labor forces. What does this mean? There is a demand problem! Developed markets have embarked on QE (particularly the US, Japan, and Europe) has led to significant capital inflows into emerging economies (Brazil, Russia, India, China, and South Africa, commonly known as BRICS), particularly China. This liquidity came at a time when governments were involved in internal growth projects to stimulate domestic demand. This led to a boost in the demand of commodities, and possibly capital goods. This demand however was not real and was caused mainly by global misallocations of capital and speculation, as investors were looking for excess returns. This led to excess capacity and that is why commodity prices have been crushed by this house of cards. All the excess liquidity caused commodity prices to rise without real global demand for them, and now we are witnessing the fall out caused by deflationary forces at time when the USD is strengthening and global debt levels are at record highs.

This has led to a world of deep imbalances among different countries and different sectors of the global economy. Each country has its own inflation and monetary histories, along with boom and bust cycles. As a result, each country has formed “beggar thy neighbor” policies acting out of self-interest, and this has manifested itself in the form of trade and capital flow imbalances between countries.            

Aside from liquidity, the world is awash in irresponsible monetary policy with unknown and certainly unintended consequences. If you are confused by what this all means, you are not alone. Fiat currencies have gone wild, and it is time for the people of world to be protected from the actions of a select few who pretend to have an idea of the future. Financial freedom is a right all people should enjoy. Former CEO of UBS and Credit Suisse Oswald Gruebel has openly voiced his support for Bitcoin and distrust of fiat currency. It looks like he is onto something.

February 08, 2015 /George Samman
Comment

Why the European Central Bank is Paving the Way for Virtual Currencies.

February 02, 2015 by George Samman


he European Central Bank is finally launching its major quantitative easing (QE) in order to fight the euro zone’s slide towards deflation. But with the evident failure of this monetary policy so far and the emergence of negative interest rates, is the ECB creating the perfect storm for virtual currencies as a viable alternative?

From March this year until September 2016 the ECB will buy €60 billion (US$68 billion) of assets a month, a total of €1.1 trillion over the given period. Moreover, the President of the ECB, Mario Draghi, left room to extend the program if necessary.  The ECB has been historically slow to take action and that begs the question whether this is “too little, too late.” 

What is Quantitative Easing?

Quantitative easing (QE) is monetary policy used by a central bank to stimulate an economy when standard monetary policy has become ineffective. This is done by the a central bank buying assets from commercial banks and other financial institutions in order to increase asset prices and lower yields.

This policy is expansionary because at the same time it increases the monetary base.  i.e. the amount of money in the system. The purpose of this is to try and stimulate an ailing  and can be done in a variety of ways.

The ECB has only one mandate, which is atarget based inflation number, as opposed to the Federal Reserve, which has 2 mandates that consist of a target based inflation number and a target based unemployment number.

Currently, a whole slew of countries in Europe (Germany, Finland, Switzerland, Denmark, Netherlands, Sweden and Austria) have negative interest rates. This means borrowers are paying lenders to hold their bonds. This suggests that people perceive these bonds as extremely safe and are willing to pay to hold them due to the risk averse nature of European investors. 

QE has been launched to move investors out on the risk spectrum and into riskier asset classes, which in theory will help stimulate the EU and create a wealth effect and trickle down to all citizens. Unfortunately, this is usually not the case.

The EU has failed in their inflation target number, and as mentioned above are fighting offmassive deflation. The chart below shows this:


Implications of European QE

As has been mentioned in previous articles, the USD has strengthened against all other major currencies. This is because as the US economy is perceived to be the strongest economy in the world right now, it has stopped asset purchases (QE).

It is also believed by the majority of pundits that the Fed will begin an interest rate hike cycle. Below is a 10 year chart of the USD vs. the Euro. As you can see, the USD has surged to new highs and broken through major resistance levels, while the mirror opposite has happened for the Euro.  It has fallen through major support as a result of the announcement of QE and fears of aGrexit.

ca13c2148091e2aa3eafc227fda04a69.png


Elliott Wave has put together a great chart of the USD. It appears that this is just the beginning of a larger move that will have really bad implications for commodities and and apply additional deflationary pressure.

Short term the USD might be ripe for a pullback, but the chart below shows that a major new uptrend is underway and has only just started. With 16 Central Banks worldwide actively involved in monetary easing policies, and the Fed looking to tighten at some point relatively soon, this move will very likely continue for the USD.


This has also had major implications in the commodities space as the USD and commodities have an inverse relationship. This is mainly due to commodities being priced in USD. Again, this is very deflationary. The chart below shows the USD vs CRB. CRB is an index that includes all major commodities. 


This has also had a big impact on bitcoin like all other commodities priced in USD, as it is down dramatically year over year.

Deflation Is Still Winning

Despite all the monetary policy being used, deflation is still winning. This is a problem because all traditional measures that are being implemented are not working.

While Central Bankers believe they have the answers, it appears they couldn’t be more wrong. Does the chart below represent a successful policy for a recovery? Quite the opposite. What will be even worse are the unintended consequences wrought on the citizens of the world.


All of these measures are failing despite historic fiscal and monetary easing. Notice that Eurozone prices are already in negative territory, and the trajectory of the others suggests that the rest of world is not far behind.  At this point it seems unlikely the ECB will be able to fix a broken monetary union from the throes of deflation and perhaps outright depression that may be on the horizon.

As Central Banks continue to cause currency wars with global fiat devaluation alongside Negative Interest Rate Policies and QE, the existing monetary regime is  proving inferior due to irresponsible policies that are simply not working. This opens the door for a new system based on virtual currency, as suggested by Greece’s new Finance Minister, Yanis Varoufakis, to take the torch and build a more transparent ecosystem while providing the necessary liquidity to maintain a healthy economy.


February 02, 2015 /George Samman
Comment

Bitcoin and What Happens in the Aftermath of Bubbles (JAN 17)

January 17, 2015 by George Samman


This article will explore 2 questions: Has bitcoin bottomed yet? And, what does the aftermath of major bubbles bursting look like and its implications for price?  

Thursday, bitcoin had a relief rally in sympathy with most other commodities as the Swiss National Bank (SNB) de-pegged the Swiss Franc from the Euro. This was a surprise move by the SNB but was necessary as being pegged to the Euro has been killing the Franc as the Euro has been sinking against a strong dollar due to Eurozone economic malaise. 


A previous article written on this subject can be found here. There is a lot of speculation as to why they did this now and the prevailing sentiment is twofold: the SNB expects the EuropeanCentral Bank (ECB) to launch massive QE and this will further weaken the Euro so they wanted to get ahead of the curve as the SNB has had to purchase a ton of Euros to protect the Franc and their threshold has been reached.

As a result, the Swiss Franc surged and the Euro weakened, while the USD strengthened. All commodities (gold, oil, copper, silver, bitcoin etc.) also saw a sharp rise in anticipation of QE coming.

Has bitcoin bottomed yet?

The simple answer is no, not yet.  As mentioned above, bitcoin had a relief rally yesterday in due to the SNB news in combination with an extremely oversold chart. A relief rally generally occurs in a downtrend, when buyers show up and shorts cover but it is nothing more than a countertrend move and is fleeting at best. As the chart below shows, the downtrend is still intact and yesterday on the daily chart shows a failed attempt to put in a bottom in the form of a Bullish Engulfing Pattern (see here). 

As a result, there is more downside. Price discovery is a process, but its looking likely at the very least we get a retest of the 160 level, with an eye on 133, which is the Mt. Gox low as mentionedpreviously. Volume has picked up along with volatility, so the bottoming process continues.


Generally, price precedes news.  With this downtrend strongly in place, one can assume whatever news comes out will be bad.  As we continue to bottom, the bad news can be assumed to be in the price and will not lead to a leg lower. In other words, it will be “priced in.”

What the news will be is anyone’s guess, but certainly something is overhanging Bitcoin. In fact, one sign of a bottom will be when bad news comes out and price doesn’t react to it or reacts in an opposite than most people expect.

What happens in the aftermath of bubbles?

The bitcoin price bubble has burst - that can not be denied. This is a major bubble that has popped as bitcoin has broke through many major support levels on its way down, and is still sinking. Below are charts of other major bubbles and unless one is visually impaired the similarities should be striking. The reason I display these charts is because the aftermath of price bubbles is similar for all of them, and bitcoin should be no different.

This is the Japanese real estate bubble:


This is the Dutch East India Company:


This is the Dot-Com (1999-2000) bubble:


This is Silver in 1980:


And finally this is bitcoin:


Let’s all admit that the bitcoin price bubble has popped. But what we can expect as price searches for a bottom? 

For now, we can expect volatility to hold up since the bottom isn’t locked in yet.  Right now, it looks like we are seeing bottom fishing happening. This is when people are looking for a bottom without being presented of any evidence of such.  It’s a sort of front-running for a bottom in anticipation of prices going higher at some point.

Once again, bottoming is a process and takes time. History shows that as a bottom forms, volatility dies off as buying and investment interests wane.  Traders also move away from the asset as volatility dies in search of better returns elsewhere. Fundamentals start to matter and price just doesn’t begin a massive upside move.

In fact, it remains range bound for long periods of time. Within this range, I would expect to see large moves, though the price should not to go back to its highs for quite a long time. During this time, companies will continue building on the protocol with the price becoming ancillary as innovation moves forward, which in turn could lead to surges in price as well as many macro economic factors down the road.

In an interconnected global world, things change rapidly and the price is no different. This is a model based on past bubbles and could be different with bitcoin for a variety of reasons, but generally the pattern fits and I would expect a range bound price and a period of low volatility for a while once the bottom is established.

Below is a chart that shows the stages of a bubble bursting and the aftermath:


365a88090fd62d730ecdd3bef7c8463b.png


January 17, 2015 /George Samman
Comment

When Will the Price of Bitcoin Bottom Out? (JAN 10)

January 10, 2015 by George Samman


People are wondering when and at what price bitcoin will bottom and there are many opinions on this matter.

This article will not explore a certain price or date when bitcoin will bottom but some of the characteristics that need to be shown to know that a real bottom in place. Instead, this article will explore the concepts of panic selling and capitulation as well as what a bottom will look like if these things occur. To date, you have not seen either of these things play out in the bitcoin price, as the selling has been very orderly for quite a while.

What are capitulation and panic selling?

Essentially, capitulation comes from panic selling. In essence, capitulation is the final phase in an extreme downtrend when sellers are willing to get out at any price (this is where the term “panic selling” comes from). It happens on tremendous downside volume at time when there are no buyers to be found. This can be called a “buying strike.” This leads to a cascade of selling that becomes disorderly and looks like it may never end. This image defines it:


Notice the orderly steps down at the beginning followed by a free-fall. The free-fall looks like the bottom but there is usually one more step down, which leads to despondency and malaise. It generally ends in a selling climax. The selling begets more selling and it looks like the price will never stop going down. Below is a chart of the S&P 500, which I have labeled based on the famous Fear and Greed cycle chart.


Here is the S&P chart from 2007 until now:


Notice in the chart above the increase in volume on the downside. Volume generally increases dramatically in down moves. The red line going through the volume is a 50 day moving average of volume and shows a massive increase as we entered panic selling and capitulation.

At bottoms, volume generally falls. This is because the selling reaches a climax and there is no one left to sell and the buyers have left the building. However, there are signs that finally the selling is done in the form of different chart patterns forming something that resembles a Bullish Engulfing Pattern or a Hammer with a very long tail (if you use Japanese Candlesticks). Tone Vays has done a great job of discussing these patterns here and showing what they look like.

The Bitcoin picture

The bitcoin chart has reached a state of denial according to the greed and fear cycle.  Despite all of the good news, including the reopening of Bitstamp the price keeps heading lower. 

The bulls keep holding on thinking the price has gotten low enough. Unfortunately it hasn’t. Until the perma-bulls start to get scared and start selling thinking the price is going to 0 as well as we see shuttering of mining activities and businesses closing their doors, it’s very hard to say we have a true bottom.

Below is the BTC chart where the selling has been too orderly and no bottoming patterns have taken shape.


Once we get to a point where people are no longer focusing on the price as the main indicator, the innovation in Bitcoin will become the focus again (which it should have always been) and there is a good chance that’s when we will see the real bottom as well.

January 10, 2015 /George Samman
Comment

The Drum Beat of Deflation is Growing Louder: The Intermarket Picture

January 08, 2015 by George Samman


The global macroeconomic picture is sending out a message and that is one of deflationary forces starting to take hold.

In past articles it was discussed what this means and its likelihood. With each passing day the probability seems to grow and global central banks are beginning to take action (Bank of Japanand the People’s Bank of China) or looking more likely to take aggressive action (European Central Bank). 

It is safe to say at this juncture that the Federal Reserve is watching this all unfold and will probably be forced to wait to raise interest rates. This article will examine some of the asset classes that are being affected by deflation as well as those causing the deflation themselves.

The Big Gorillas in the room: USD and Oil

Unless you live under a rock, you will have noticed the price of oil has collapsed in epic fashion (see chart below). I have included a chart which goes back to 1982, to show the historic nature of this collapse and where possible support lies (around the US$40 area) now that we have broken through several key support levels. 

To put it simply this decline in the price of oil as well as the velocity of the decline matter and matter greatly from a deflationary standpoint. Generally speaking, this decline was so swift and fast that the damage, which has been wrought, won’t be known for a while. Falling commodity prices can be dealt with by companies and nations when they are orderly, but when they fall at such speed it leaves widespread damage. 

It goes without saying that energy companies, which produce oil (think U.S. shale) as well as the economies of country’s (e.g. Russia and Canada) that are dependent on oil exports will be greatly affected. This is highly deflationary and is pulling global yields lower.

The currencies of these energy exporters have weakened as a result, which has caused the USDollar to reach levels it hasn’t been in over a decade (see previous article on the USD). This is causing a vicious cycle whereby commodities are being pushed even lower due to USD strength as commodities are priced in USD.


All major currencies are falling and causing the USD to rise in the case of the Canadian Dollar(CDW), the British Pound (XBP) and the Russian ruble (RSX), as falling energy prices are putting downward pressure on these currencies.

In the case of the Euro (XEU) and the Japanese Yen (XJY), their lax monetary policies are about to get even looser due to stagnating economies. In other words, falling foreign currencies are the result ofweaker economic conditions than those in the United States. The USD also becomes a safe haven as all other currencies fall, which is also adding to its rise. See the chart below:


In general, when global economic conditions are improving bond yields are expected to rise. We are not seeing that even in strong economies like the United States. In fact, the price of bonds is rising to new highs and their associated yields are falling to new lows. This does not depict a healthy global picture.

All over the developed world, deflationary forces are pulling bond yields lower as European and Japanese bond yields are already at all time lows.


The 30 year Treasury Bond has also reached a 10 year high:


Bond yields are falling and bond prices are rising because global investors are looking for safe havens (US treasuries of all duration, the US Dollar, and even gold.) This is being caused by tensions in Greece and the Eurozone as well as the deflationary forces mentioned above. For all intents and purposes, Europe is back in recession and deflation is starting to kick in. Eurozone consumer prices fell to negative -0.2% for the first time in 5 years.

The price of gold is starting to improve and Taariq Lewis, CEO of Digital Tangible attributes this “to fears of a Greek exit (Grexit) and a stalling global economy as well as lingering doubts on the resilience of US growth from Q3.”

While the chart below shows the price and the accompanying technical indicators (see comments below on chart) are improving, USD strength will be a major headwind for gold as well as all other precious metals and commodities.


Bitcoin

The chart below speaks for itself. Bitcoin continues to struggle mightily and the price action and direction have been commented on many times. Despite trouble in Europe, the bitcoin price has decoupled and continues its march lower. The dollar’s strength is hurting bitcoin like all other commodities as well as the flight to safety, which was mentioned above. So is the rise of the Shanghai Index and China’s attempts to stimulate its domestic economy. The Bitstamp issues are certainly not helping either. 

A general comment on price is that without panic selling and capitulation it will be difficult forbitcoin to find a real bottom. Unfortunately, this is yet to show up in the charts and the long decline continues as shown below:


Nothing happens in a vacuum and it is important to take note in a global economy that the relationships between all asset classes in different countries matter greatly.  These factors control capital flows, which all look for profits. The deflationary backdrop of the world is distorting global capital flows as well as the ever evolving economic landscape.

The central banks are hell bent on stopping deflationary forces from winning, and aiding growth. We are only beginning to see what happens with a strong USD and we are yet to see what the collapse in oil will bring for the global economy. 

Certainly, the coming months will reveal how this will unfold. By paying attention to how different asset classes react to these economic events we can make more informed decisions on when and how to invest.

January 08, 2015 /George Samman
Comment

Has China Abandoned Bitcoin?

December 28, 2014 by George Samman


There has been much conjecture on the role China has played in the rise and fall of Bitcoin’sCT r:  3 price. Most in this space recognize that China has been leading the Bitcoin marketplace in terms of trading and volume. If this is the case, perhaps looking through some charts would shed some light on where Chinese money is flowing.

Below is a chart comparing the Shanghai Composite with the price of Bitcoin. First, let’s look at the month of July, where the Shanghai composite started its rally, while Bitcoin topped out after making a rally of its own in the wake of the Mt. Gox debacle. In mid July, The People’s Bank of China (PBOC) announced CNY 1 trillion of "Pledged Supplementary Lending" PSL to the China Development Bank. This was later dubbed quantitative easing QE lite.

The second major event happened in November right around the time Bitcoin had a false breakout. (See my previous writings on this). This led to another surge in the Shanghai Composite and another leg down in the price of Bitcoin. This was a surprise rate cut by the PBOC coupled with A shares being available to global investors, as well as a linking between Shanghai and Hong Kong. This was thanks to the Shanghai-Hong Kong Stock Connect, often called the “through train,” which also allowed individual mainland Chinese investors to buy the big-name companies listed in Hong Kong.


Why is China doing this?

These are all moves to stimulate China’s slowing economy by opening China’s financial markets. China has ambitions to make Shanghai a global financial center. It also allows mainland investors to put their money to work in the right companies and allows Hong Kong and the rest of the world to speculate on mainland Chinese companies. Thus far it has been noted more money has been flowing into China, than out of it.

These moves are also put into place to raise the investing standards of the average Chinese retail investor, as well as internationalize the currency (yuan). They are also part of the major reforms the government has decided to initiate in order to clean up the financial and banking sectors, along with state-owned enterprises (SOEs). Thus far these moves have worked as the Shanghai Composite has broken out of a multi-year downtrend and has surged.

The chart below is a monthly chart of the Shanghai Composite going back to 2005. This shows the beginning of what looks like a major move:


As a result of the surge in the Shanghai margin, trading has surged massively in China. Leverage has proved a potent accelerant. Margin trading in Shanghai and Shenzhen has doubled since July to 800 billion yuan (US$130 billion), notes Chen Long at GaveKal Dragonomics. 

This, along with declining interest rates in the market for interbank funds, further reduces returns on savings. The retail investor in China is back in the stock market, with the rate cut in the property and housing markets as well. Below are a few charts showing the surge in margin and futures trading in China:


Here is the surge in futures trading:


Why does this matter for Bitcoin?

Simply put, there are asset classes that are outperforming Bitcoin within China itself, and outside of China, as well and many Chinese investors participating as the charts above show. One of the major arguments for Bitcoin in China was a way for wealthy Chinese to move money offshore, which may still hold true. However, government attempts to stimulate and reform the economy have worked and investors are buying into it.

Money flows to where money can be made, and this year that has not been Bitcoin. There are far more liquid markets experiencing price appreciation. Bitcoin has such a small market cap presently that it would not take much money moving out of it and being reallocated into other asset classes for price to move down. It does appear as Chinese money has stopped accumulating Bitcoin and has become more of a speculative trading vehicle. In other words, there isn’t much “committed” money.

December 28, 2014 /George Samman
Comment

Gold, Bitcoin & the US Dollar amid a Global Economic Slowdown

December 23, 2014 by George Samman


The speculation about the Swiss National Bank (SNB) knowing something when they de-pegged the Swiss Franc from the Euro proved true today as the European Central Bank (ECB) launched its own QE today in the form of a 1 trillion euro government bond buying program - approximately 60 billion per month, which is more than the 50 billion people were conjecturing.

This program will start in March 2015 and go through September 2016.  This is the ECB’s latest attempt to battle deflation and try to reflate the Eurozone. On the heels of this news, the Euro sank to 1.14, gold touched US$1,300 for the first time since mid August, and the USD surged to 94.72 (see charts below).

Also, The People’s Bank of China (PBOC) is injecting 500 billion Yuan (US$81 billion) into the nation’s largest banks, according to a government official familiar with the matter, signaling the deepest concern yet with an economic slowdown. Not to mention, Canada also slashed interest rates today as well. 

We are witnessing unprecedented global stimulus to fight a major economic slowdown. Under this backdrop, it is easy to see why the USD is surging as the US has stopped QE and indicated a rate hike at some point this year. The US is perceived to have the strongest economy in the world.

As mentioned in previous articles, the USD is controlling the intermarket picture. The 15 year monthly chart shows the USD at a place it hasn’t been since 2003.  Perhaps parity with the Euro will happen once again. This move is a major one as the chart below is a monthly chart and at the bottom right the 50 month moving average looks ready to cross the 100 month moving average. This is significant and proves this major uptrend is just starting.


The 5 year monthly Euro chart is almost a mirror reflection of the USD. It has blown through all major support areas. I drew Fibonacci retracements in to look for possible support areas and 111 and 104 seem like the next major areas of support.


In Spite of USD strength, gold has surged higher. The reasons for this are obvious:  global deflation, global growth slowing, currency debasement globally (in fact Gold in Euro and Yens terms has been surging for a while), and doubt about the US recovery. 

Expect to hear the term “currency war” in the coming months as all the liquidity being provided by central banks causes massive displacements of capital. If the dollar continues strengthening, the rally in gold should be capped.  At the bottom of the gold chart, where there was once a strong positive correlation with bitcoin (meaning gold and bitcoin went up together) now we are seeing the exact opposite - a negative correlation - where gold is going up and bitcoin is going down. It seems like gold is being considered a superior store of value and flight to safety along with the USD.


As noted in previous articles, the end of July into the beginning of August is when the USD dollar started surging along with the Shanghai Composite. Gold held steady within that period and in the last month has begun its own up move.  Bitcoin has dropped tremendously in that time frame and is trying to find some stability. For now, this pattern still holds. Money is flowing into other asset classes.


Many people predicted the end of the dollar, a European banking collapse, and global depression. This scenario has not played out as global central banks have launched stimulus effort to fight off deflation. The US is the only one not stimulating the dollar and the US stock market has been a major beneficiary.

Perhaps the collapse of oil, coupled with the worry of the ECB, the PBOC, and SNB, along with a whole host of other countries has left an interest rate hike on hold for the “foreseeable future.”

What this all means is there’s a whole lot more liquidity sloshing around the globe and it is seeking places where it will make big returns. So far, bitcoin has not been the beneficiary of this. As I have mentioned in a previous article, the price is still searching for a bottom. Bottoming is a process and does not happen over night. In the mean time, there are a few headwinds that need to be overcome in order for the BTC price to stabilize. 

December 23, 2014 /George Samman
Comment

arket Analysis: Japan, Gold and Bitcoin

October 05, 2014 by George Samman


he US Federal Reserve ended QE last week and promised to keep rates “extraordinarily low” for an extended period of time. 

Passing the QE torch

However, the great QE rotation has been passed to the Bank of Japan (BOJ) and they answered the call mightily Friday by increasing their bond purchases (QE) by a third. They will not only be buying bonds but stocks and real estate.

Meanwhile, the Japanese pension fund announced it will increase its allocation to domestic and foreign stocks.  On the tail end of this, global stock markets roared to the upside and the Japanese stock market (Nikkei) has reached a 7 year high and blasted through 14 year old resistance as it looks poised for more gains and to end its 25 year bear market (see chart below). This has resulted in the Yen making a 7 year low in an attempt to make Japanese multinational corporations more competitive. 


The net effect of this is the BOJ exporting deflation to the rest of the world and sending the USDollar to 5 year highs and looking to break through major resistance (see chart below). This has led to a rout in all commodities (as commodities are priced in dollars) and foreign currencies as described in a previous article.

This chart shows all the major global currencies vs. USD:


This chart shows the performance of the all the commodity groups in the wake of dollar strength and the specter of deflation. Energy, agriculture, and precious metals have been hit the hardest.


Bitcoin and Gold

Below is a chart of Gold overlaid with the US Dollar since 2010. This chart could be any commodity, but since Bitcoin and Gold have a strong positive correlation (.87 currently) I thought it was worth showing what dollar strength does to Gold and essentially all other commodities.  I have labeled the chart and it really speaks for itself.


The last and final chart I have overlays Bitcoin with the S&P.  Until August, they moved in the same direction, and then in July/August they decoupled and starting moving in the opposite direction.  This was around the time the US Dollar starting making its big move to multi year highs.  

I show and describe the correlations between bitcoin, Gold, USD, and the S&P below.  While these are small datasets, trying to find patterns in the data and where global capital flow is what we are looking for.  Perhaps a major correction in the S&P or an easing of US Dollar strength and a subsequent rally in commodities can lead Bitcoin out of its current downtrend.  

Also, seasonal patterns are coming into play for both Bitcoin and gold. November/December has seen strong uptrends in both during this time of year. Obviously with gold this pattern holds true for a much longer period of time, but if we are going to see the same patterns repeat themselves we should start to see some accumulation in these asset classes as they both massively underperformed. 

Another point I have noticed with Bitcoin, is that it had the bear whale  bottom at around 300, subsequently it rose to over 400, and is now back down in this area retesting. It has been a classic retest on low volume, which is what one would want to see before the next up move is confirmed. So far, Bitcoin has held its support area around 330 on this retest, without an acceleration in volume to the downside.  


October 05, 2014 /George Samman
Comment
  • Newer
  • Older

Powered by Squarespace