SAMMANTICS

  • Blog
  • About
  • Images
  • Research/Whitepapers
  • Stablecoin Surveys
  • Talks/Media

Bitcoin Price Analysis: One Strong Bear (Week of June 7)

June 07, 2015 by George Samman


Price at the time this article was written was: US$225.00

Last week’s article began with:

“The price has broken below some significant levels and looks like it's going to test some very important levels below. The 50-day EMA has been a massive wall and it looks like the price has run out of energy trying to get and stay above it. Now a big test is coming, as price has broken below US$231, which has been mentioned in many previous articles as an area that needed to hold. Look for US$220 and the massive support area of US$210 to be tested.”

So far the US$220 support level has held, but price has not been able to move to the upside. It looks like it’s consolidating below that ~US$231 level and has been mentioned before the 50 day estimated moving average, which is now ~US$233.  The US$220 mark is now providing support. If this doesn’t hold, then the big support area of ~US$210 better.

Long Term

The 1-year (long term) chart for bitcoinCT r:  3 has been and remains bearish. The price remains below all three of its EMAs. The 50 day EMA now sits at ~US$233 and dropping.

All three EMAs are super tight, particularly the 50 (US ~$233) & 100 (~US$244) days as they continue to compress. The Bollinger Bands have started to resolve their tightening after last week’s breakdown and its continuation for most of this week. The y have begun to loosen as price has consolidated at lower levels, which means price has more room for a downside move indicating that US$220 and ~US$210 remain in play. Nevertheless, volatility seems ready to start picking up.

The Relative Strength Index (RSI) looks to have put in a quadruple top a few weeks ago and continues its move lower. It continues making higher lows, which isn’t a good sign either. The MACD (moving average convergence divergence) has remained below the zero line and has been flat for months. This is all while the price sits in this range so if the price begins to move, expect MACD to follow.

Overall, bitcoin volume on exchange continues to be small and shrinking. These are not signs of a trend change.

On Balance Volume (OBV) has been flat for months and is telling the same story as the other indicators, which is that price continues to be in a low volatility and low volume environment. Volume should come in before the next big price move as volume generally precedes price.


Ichimoku Clouds

The 1-year Ichimoku (cloud chart) has broken down. Price has entered from below the bottom of the cloud and now has broken out of the lower bound of the cloud. This is bearish news and more downside price should be anticipated. The ~US$233 mark is now providing big resistance (the lower bound of the cloud) and is at the same level as the 50 day EMA, confirming that this is big resistance.

The cloud ahead has had a bearish crossover as well and is also creating major headwinds for price. This will cause additional pressure on the price.

The Chikou Span (Lagging Line) never entered the cloud, and the Tankan Sen (Conversion Line) and the Kijun Sen (Base Line) have broke down and pierced the lower cloud indicating that lower prices are ahead.

Last week, it was noted that all if all these things happened it would be very bearish for price. This continues to be the case. For further definitions of what is being discussed, please refer to this previous post on Ichimoku cloud charts.


Intermediate-Term Trend

The ~US$230 area didn’t hold and Fibonacci retracements have been drawn from 2 price tops: the mid-November high of ~ US$424 and the mid March high of ~ US$298.

Since the big support area ~ US$230 has been broken, other big support areas can now be identified, which are ~ US$219 and then ~ US$200. This ~US$219-220 has held so far, but will certainly be tested again. Expect major support in the US US$200-210 area. If this doesn’t hold, then price will probably test the lows made in early January.

The RSI topped out a few weeks back and is confirming the price. There are no divergences forming and RSI remains weak. The Money Flow Index is in oversold territory and confirming a lower price move setup.

Included is the Directional Movement Index (DMI), which looks at buying and selling pressures. The blue line indicates buying pressure, the red line indicates selling pressure, and the orange line is the ADX, which indicates the strength or weakness of a trend. 

Selling Pressure has risen since last week, while Buying Pressure has fallen. This is consistent with what happened to price since it fell through the ~US$230 support. The ADX has crossed over the Buying Pressure Line last week and has now crossed over the Selling Pressure line at higher levels, initiating a sell signal because this means selling is starting to pick up momentum. This is yet another bearish sign.

The Bollinger Bands were super tight last week and have begun to widen as price has resolved to the downside. This should mean more weakness in price and perhaps a bigger (bearish) move may in the cards.


Short-Term Trend

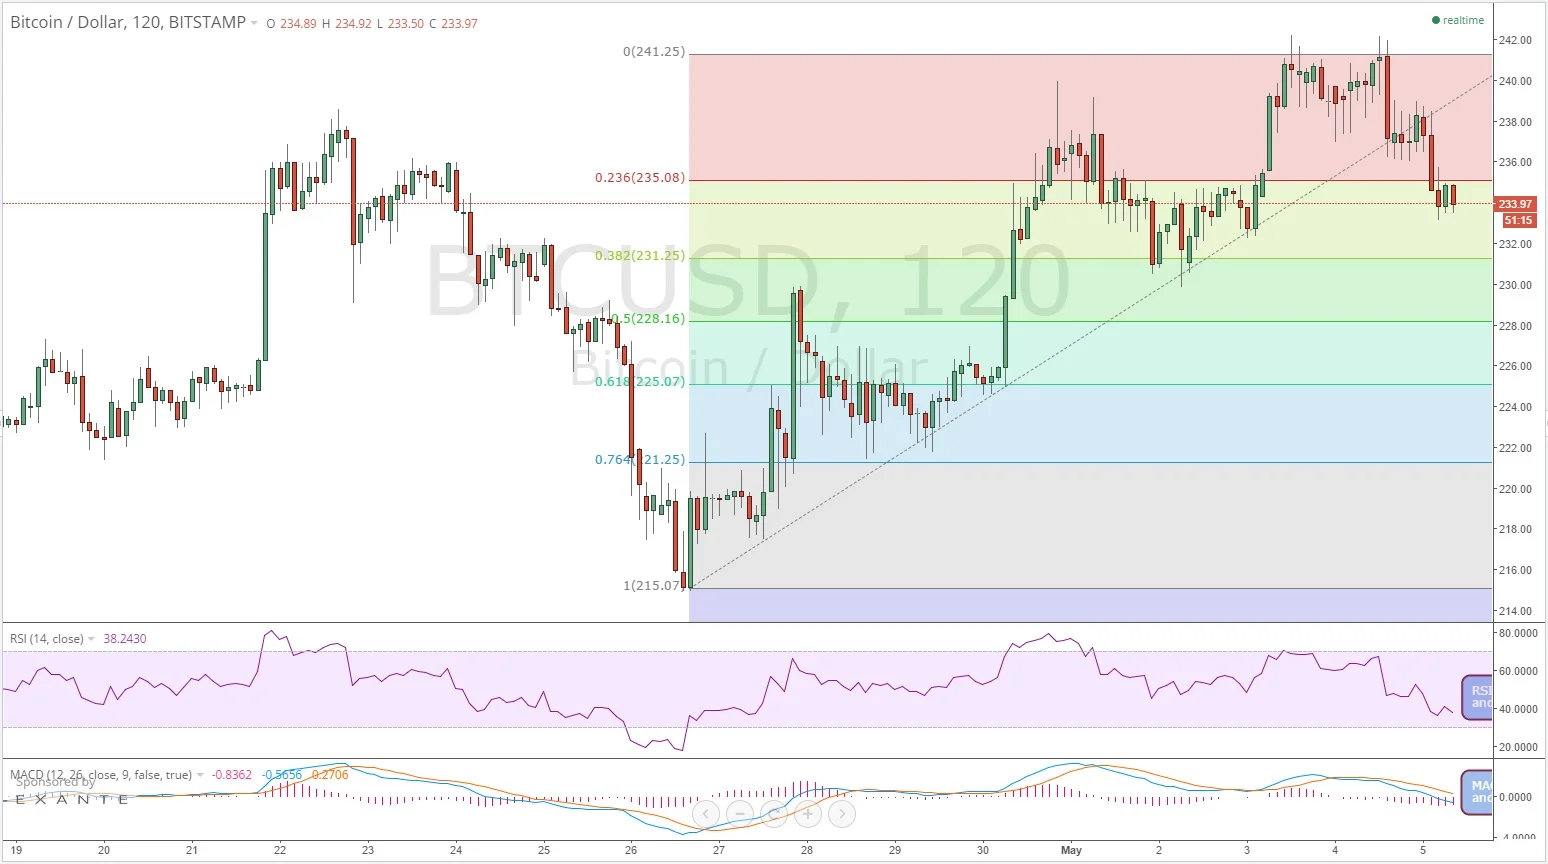
Looking at the short-term trend (May 24 price high of ~US$240 and June 3 ~US$226) using Fibonacci retracements, last week it was said that “US$235 and US$231 are really big areas and have broken. Price is at its lowest point since hitting the US$240 high. The US$225 and US$221 come into play, but will probably be stops on the way to testing the ~US$210 level.” 

Price has broken below all these levels except for that ~US$220 area. This needs to hold. If not, next support is at ~US$219, ~US$217 and massive support at the ~US$210 area.


Big Move Imminent

Bitcoin’s primary downtrend remains intact and all support levels continue to break down on the way to ~US$210. It’s been a slow bleed down but all the indicators in multiple time frames are pointing to a test of key support levels below.

The 50-day EMA and the Ichimoku cloud are very big resistance as price has continuously failed to stay above the 50 day average, nor break through the upper bound of the cloud as the price is now decisively below both indicators.

A retest of the ~US$210 area continues to look like a possibility.

June 07, 2015 /George Samman
Comment

Cash is Going Extinct, Unless You Pay to Protect It

June 04, 2015 by George Samman


And so the war on cash begins with its first casualties: Swiss pension funds and large depositors at banks worldwide are beginning to feel the impact of negative interest rates, which have the potential to unravel the global economy.

First casualties

Swiss pension funds are under attack by the very central bank that should be protecting the prosperity of its people, the Swiss National Bank (SNB). The SNB has cut rates so low that from a nominal level they have breached the zero lower band, resulting in an essentially negative rate. This has caused Swiss pension funds to begin to withdraw cash from the bank and store it in a vault since now the cost of carry is greater than cold hard storage of cash.

With negative interest rates, Swiss pension funds now have the honor of paying the bank to hold their cash for them. One Pension fund manager calculated he would save CHF 25,000 per year on every CHF 10 million by withdrawing it from a bank and putting it into vault storage. Yes you read that right!

Negative interest rates are simply a tool to get banks to loan out money and help stimulate the economy. Pushing interest rates below the level of inflation by central banks should theoretically stimulate growth as borrowing becomes cheaper but it has also had the reverse effect of making risk-averse individuals and investors go far out on the spectrum in search for yields. The Financial Times describes this new phenomenon:

“Welcome to the Alice in Wonderland world of negative interest rates, a topsy-turvy universe where central bankers are so alarmed at the prospect of weak inflation that they have cut borrowing costs below zero, in effect charging financial institutions to leave their accounts in the black.”


Not Just a Swiss Thing

Pension funds in Switzerland are not the only ones to be feeling the affects of negative interest rates. JP Morgan has told large depositors that they would be charging a “balance sheet utilization fee” of 1% a year on deposits in excess of the money they need for operations. The goal is to get rid of US$100 billion in deposits and the targeted customers are other financial institutions.

In essence, this becomes a negative interest rate on these deposits. In other words, it is more expensive for banks to pay interest to depositors than hold their money due to extremely low interest rates and the cost and laws behind new regulations.

“Because large, uninsured deposits would be expected to leave most quickly, the rules will now require that banks maintain reserves for those deposits that they cannot use for profitable activities like making loans,” writes Emily Glazer of the WSJ. “That makes it much less efficient or profitable for banks to hold these deposits.” 

JP Morgan is not the only bank that has this problem others include: Citigroup, HSBC, Deutsche Bank, and Bank of America. In other words, welcome to the world of forced vault storage of cash.

War on Cash

Lower commodity prices, stagnant wage growth, low returns on savings and low GDP growth in developed economies are all signs of the one word that scares central banks – deflation. 

Central bankers believe negative interest rates can fix this, and many think they should go even lower to help stimulate economic growth. Physical paper money is a big problem in this sense because it is an alternative for customers who want to withdraw their deposits (like pension funds and store in a vault).

“Physical paper money provides the check against negative interest rates for if they become too great, people will simply withdraw their funds and hoard cash,” says economist Martin Armstrong. “Furthermore, paper currency allows for bank runs. Eliminate paper currency and what you end up with is the elimination of the ability to demand to withdraw funds from a bank.”

Electronic currency also transfers complete control of the money supply to the central banks to implement whatever policies they desire. Armstrong further explains why central banks dislike physical cash:

“Paper currency is indeed the check against negative interest rates. We need only look to Switzerland to prove that theory. Any attempt to impose say a 5% negative interest rates (tax) would lead to an unimaginably massive flight into cash. This was already demonstrated recently by the example of Swiss pension funds, which withdrew their money from the bank in a big way and now store it in vaults in cash in order to escape the financial repression. People will act in their own self-interest and negative interest rates are likely to reduce the sales of government bonds and set off a bank run as long as paper money exists.”


Cold, Hard Cash as a Store of Value not a Medium of Exchange

New federal rules penalize banks for holding deposits that are prone to flee during a crisis or stressed environment. This essentially is any depositor (including other banks) who is over the FDIC insurance limit of US$250,000, making this policy a potent weapon in the war on cash. 

Therefore, most large depositors don’t hold their money in a savings account but in highly rated bonds as a preferred store of wealth. These bonds have super low yields, which essentially come out to be the cost of storage to hold them at large institutions. This, in turn, takes large amounts of cash out of circulation and not used as a medium of exchange, but a store of value. 

As has been noted in previous articles, this has decreased the supply of bonds, particularly safe bonds, in the market. Highly rated corporate bond inventories have dropped dramatically in theUS and Europe (75% and 50% respectively) and demand for these bonds has risen. This has driven the price and the yields to drop dramatically to a point where they are negative once the cost of the newly implemented deposit fees is taken into account.

Stricter regulations have also caused banks to keep more bonds on their balance sheets. In other words, cash is going extinct, unless you pay to protect it.

The Liquidity Paradox

Liquidity paradox is a term coined by Citibank analyst Matt King to explain Central Bank policies of QE and extreme easing, which has herded investors into risky assets to get returns at a better rate than near 0%. 

According to Citi, this has caused “large scale mismatches in the number of buyers and sellers.” This has resulted in investors all investing in the same manner in the search for returns giving rise to the liquidity paradox:

“[…] because the more liquidity central banks add, the higher the risk of a serious liquidity crunch -  started out in corporate bond markets but is now distorting government bond,currency and share markets. It says while the post-financial crisis crackdown on own-account trading by investment houses was partly to blame for a decline in professional market-making, the increased difficulty of finding buyers because everyone is selling at once owes more to central banks' hold on financial markets since the crisis.”

A New Era for Banking

These policies have led to distortions in the capital markets and most people investing in the same way (herd-like investing) exacerbating the liquidity problem. Unwinding these trades is going to be problematic due to the massive one-sided trading.

Welcome to the new era of banking where banks will only accept money if customers are willing to pay for this “privilege”. Access to capital markets is being eroded and paper money is being faded out. When will enough be enough? Who would ever have thought that banks would shun cash and that the old-school vault and storage businesses would be a part of this “new economy.” 


June 04, 2015 /George Samman
Comment

Bitcoin Price Analysis(JUNE 1): The Price is Heading Lower and Looking For Major Support

June 01, 2015 by George Samman


Price at the time this article was written was: US$228.59

Last week’s article began with:

“Resolution of this range should come soon and it could be a big move since there has been less and less on-exchange liquidity in recent months.”

Technically, we are starting to get a resolution, and unfortunately it is looking like a downside one. The price has broken below some significant levels and looks like it's going to test some very important levels below. The 50-day EMA (exponential moving average) has been a massive wall and it looks like the price has run out of energy trying to get and stay above it.

Now a big test is coming, as price has broken below US$231, which has been mentioned in manyprevious articles as an area that needed to hold. Look for US$220 and the massive support area of US$210 to be tested, and perhaps in short order. It looks like more bad news in the exchange (OkCoinCT r:  6 and Igot) space has the price on the defensive and ready to move out of this tight range.

Long Term

The 1-year (long term) chart for bitcoinCT r:  3 remains bearish. The price remains below all three of its EMAs. The battleground around the 50-day EMA looks resolved and the move is lower. Major resistance is now the 50-day EMA at approximately ~US$237, but should continue lower. Price has been rejecting higher levels for well over a month.

All three EMAs are super tight and compressing on top of each other. The same applies for theBollinger Bands. The 50 (US$237) and 100 (US$247) have been giving signals of a move and the fact that price has not been able to get above the 50-day shows the move that has been waited for is lower.

The Bollinger Bands could not be tighter and have not been in the chart below for the course of a year. This has been another sign that a move was coming and it appears ready to resolve. The wound-up clock that is the Bollinger Bands and the EMAs should provide a fairly big move. How big, we shall find out soon. Based on how tight they both are, it should be a significant price move.

The Relative Strength Index (RSI) looks to have put in a quadruple top and has not had the strength to move to higher levels. It is now heading downward along with price. Also note that the MACD (moving average convergence divergence) has crossed back below the zero line and has remained flat for an extended period. This also could also unwind fast with downside momentum gaining steam. All of this has happened on very low volume. These are no signs of a trend change.

On Balance Volume (OBV) has been added as well and has been flat for months. This indicator has been added to see if it may be time to get bullish. The theory behind OBV is that volume precedes price and if there is going to be a big move up, or a reversal in price, it would be seen in volume. Still not much in the way of volume, but it’s time to watch and see, as every other indicator along with the price is showing more downside should be expected.


Ichimoku Clouds

The 1-year Ichimoku (cloud chart) looks ready to crack. Price has entered from below the bottom of the cloud and now looks ready to break the lower bound of the cloud. ~US$229 is now providing big support for the price as it is the lower bound of the cloud.

When looking at the clouds, it’s important to remember from which direction price enters the cloud. Since it entered from below, the cloud should continue to be resistance for the price, and ~US$255 (which is the top of the cloud) will be a major test, if price ever gets there.

The cloud ahead is forming a cloud lower and is starting to sag with force. This will cause additional pressure on the price.

The Chikou Span (Lagging Line) has never entered the cloud, and the Tankan Sen (Conversion Line) and the Kijun Sen (Base Line) look ready to come out of the cloud with a downside resolution. All signs are pointing to breaking out of the cloud and heading lower.

Last week we wrote: “The price is spending a lot of time not getting anywhere. It’s starting to look like it’s going to be difficult for the price to stay above the lower bound of the cloud. For further definitions of what is being discussed, please refer to this previous post on Ichimoku cloud charts.” This looks to be the case.


Intermediate-Term Trend

We said last week:

“Using Fibonacci retracements from an intermediate-term price high of US$427 recorded back in mid-November, we see that the price is above the support at ~US$230. Another Fibonacci retracement was run from the mid-March highs to look for additional support and resistance areas. ~US$233 and ~US$230 are the next support areas, with ~US$230 being a big one as it confirms the lower bound of the Ichimoku cloud. That makes it an important area to hold.”

This area has now broken. Expect tests of minor support levels below (like ~US$220), but the US$210-215 looks like it will provide MAJOR support and if it doesn’t hold, price will probably test the lows made in early January.

The RSI topped out a few weeks back and confirms the price heading lower. The Money Flow Index is also confirming this.

Included is the Directional Movement Index (DMI), which looks at buying and selling pressures. The blue line indicates buying pressure, the red line indicates selling pressure, and the orange line is the ADX, which indicates the strength or weakness of a trend. 

Buying Pressure and Selling Pressure continue to fall and are both below the ADX. The ADX has crossed over the Buying Pressure Line, which could initiate a sell signal because this means buying pressure has declined and the sellers might start to attack. Selling Pressure looks ready to cross over Buying Pressure and the ADX is heading higher, which indicates price is ready to move. If Selling Pressure crosses over, it will lead to a big move down.

The Bollinger Bands in the intermediate time frame are even tighter and the price has fallen out of the lower Bollinger Band. This should mean more weakness in price, and perhaps a bigger move may accelerate. Again, unfortunately, these are bearish signals.


Short-Term Trend

Looking at the short-term trend (May 24 price high of ~US$240) using Fibonacci retracements, US$235 and US$231 are really big areas and have broken. Price is at its lowest point since hitting the $240 high. The US$225 and US$221 come into play, but will probably be stops on the way to testing the ~US$210 level. The RSI is oversold currently and the Money Flow is heading lower. Price may bounce short term, but those big levels below should be tested. The MACD is also on a sell signal.


Big Move Imminent

Bitcoin is still in a primary downtrend and with all the tension in the moving averages and Bollinger Bands, a big move looks like it has finally begun.

The price didn’t hold above US$235 and US$230. Momentum and volume are beginning to pick up to the downside. This is not what the bulls wanted to see. The 50-day EMA has now become very big resistance as price has continuously failed to stay above this mark and now is breaking decisively below it.

A retest of the ~US$210 area continues to look like a possibility.

June 01, 2015 /George Samman
Comment

Bitcoin Price Analysis: Still Waiting on a Big Move … or Any Move (Week of May 24)

May 24, 2015 by George Samman


Price at the time this article was written is: US$237.44

Last week, the article began with:

“The good news continues to be discounted, which generally isn’t indicative of a move higher. On the other hand, there’s an old adage which applies here: ‘Never short a dull market.’”

Resolution of this range should come soon and it could be a big move since there has been less and less on-exchange liquidity in recent months.

Technically we are pretty much in the same place with perhaps a more bearish leaning slant since price is having so much difficulty staying above its 50 day EMA. As has been mentioned inprevious articles, “the slope of all the EMAs (50, 100, and 200) is sloping downward, however they are sloping less so. The 50 and 100 day EMA’s are starting to tighten as well. This all is setting up for a move.”

The 50 day EMA (~US$238 USD) is still proving to be a major nuisance, the price has not been able to stay above it for a very long time now and this can only be construed as bearish. A significant price move is still expected, however, as all the indicators continue pointing towards this happening.

Long-Term

The 1-year chart (long-term) for bitcoinCT r:  3 remains bearish. The price remains below all 3 of its EMAs. The 50 day EMA is still proving to be a major resistance area at approximately ~US$238. Price has been rejecting higher levels for well over a month.

All 3 EMAs continue to tighten. They all continue to move closer to each other and price is looking likely to move. As the 50 and 100 day moving averages continue to compress with the price underneath, a downside move looks more likely than an upside move.

Bollinger Bands have also been added and are super tight at the moment. In fact they haven’t been this tight in the entire 1-year chart. This happens when volatility declines as it has in thebitcoin price. The tightening indicates that a significant price move is coming. Think of the Bollinger Bands like a rubber band that is getting stretched out and what happens when you stretch a rubber band as far as it will go and then release it. It snaps aggressively and this is what should happen in the price.

The Relative Strength Index (RSI) looks to have put in a quadruple top and has not had the strength to move to higher levels, and is now starting to turn downwards. This suggests the possibility of a downwards price move. Also note that the MACD is sitting on the zero line and has essentially remained flat for an extended period. All of this has happened on very low volume. These are not signs of a trend change. Instead, MACD is showing that there is no momentum for an up move.

On Balance Volume (OBV) has been added as well and has been flat for months. This indicator has been added to see if it may be time to get bullish. The theory behind OBV is that volume precedes price and if there is going to be a big move up or reversal in price it would be seen in volume. Clearly that is not the case here based on the chart. It seems to be signaling that a downward continuation in price is possible.


Ichimoku Clouds

The 1-year Ichimoku (cloud chart) essentially remains the same. Price has entered the bottom of the cloud and continues to stay near the lower bound of the cloud. ~US$232 is now providing some support for the price as it is the lower bound of the cloud.

When looking at the clouds, it’s important to remember which direction price enters the cloud from. Since it entered from below, the cloud should continue to be resistance for the price and the ~US$255 (which is the top of the cloud) will be a major test if price ever gets there.

The cloud ahead has attempted a bullish crossover twice with no success. This continues to be bearish for future price and is something to continue watching out for.

The Chikou Span (Lagging Line) is below the cloud, along with the Tankan Sen (Conversion Line) and the Kijun Sen (Base Line). The Tankan Sen and the Kijun Sen have pierced the cloud but are also dragging down near the lower bounds. Momentum appears to be waning at the lower bound of the cloud and price needs to hold in the above mentioned support area.

The price is spending a lot of time not getting anywhere. It’s starting to look like it’s going to be difficult for the price to stay above the lower bound of the cloud. For further definitions of what is being discussed, please refer to this previous post on Ichimoku cloud charts.


Intermediate-Term Trend

Using Fibonacci retracements from an intermediate-term price high of US$427 recorded back in mid-November, we see that the price is above the support at ~US$230. Another Fibonacci Retracement was run from the mid-March highs to look for additional support and resistance areas. ~$233 USD and ~$230USD are the next support areas, with ~$230 USD being a big one as it confirms the lower bound of the Ichimoku cloud. That makes it an important area to hold.

A test of US$230 looks likely since price has not been able to get above the 50-day EMA and momentum continues to wane. If it falls below this level, there are some minor support levels (like ~$220 USD) below but the US$210-215 looks like it will provide major support.

The RSI and MACD are both flat and appear to be topping out. This continues to show that momentum is stalling.

Included is the Directional Movement Index (DMI), which looks at buying and selling pressures. The blue line indicates buying pressure, the red line indicates selling pressure and the orange line is the ADX, which indicates the strength or weakness of a trend. 

Buying Pressure and Selling Pressure continue to fall and are both below the ADX. This is yet another sign that momentum has topped out and price is range bound on very small volume. This is happening at low levels, which means volume and momentum are not confirming the higher move that occurred to the top of the price range. This again confirms that price is getting ready to make a move one way or the other. The ADX has crossed over the Buying Pressure Line, which could initiate a sell signal because this means buying pressure has declined and the sellers might start to attack.

The Bollinger bands in the intermediate time frame are even tighter and the price has just fallen out of the lower Bollinger Band. This should mean more weakness in price and perhaps a bigger move may accelerate.


Short-Term Trend

Looking at the short-term trend (May 24 price high of ~US$240) using Fibonacci retracements, a big base has formed at the US$235 level and is now providing support. If this breaks, a test of the ~$230 USD level should happen in short order. This area is becoming more and more important. Short term, US$235 and US$231 are really big areas. If these should break down, the US$225 and US$221 come into play, but will probably be stops on the way to testing the ~US$210 level. The RSI and Money Flow are both heading down confirming the price. The MACD has triggered a short term sell signal as well.


Big move imminent

Bitcoin is still in a primary downtrend and with all the tension in the moving averages and Bollinger Bands, a big move is still what is being looked for.

The price needs to hold above US$235 and US$230. Momentum and volume continue to be at low levels. The 50-day EMA continues to provide very big resistance as price has continuously failed to stay above this mark. 

The price action has been as fun as watching paint dry so staying cautious and patient is still the way forward. Every rally in price in recent months has been at lower levels and this latest one demonstrates that point. A retest of the ~US$210 area continues to look like a possibility.

May 24, 2015 /George Samman
Comment

The Millennial Generation: Banking’s Big Problem, and It’s a Good Thing

May 23, 2015 by George Samman


The Millennial generation is proving to be a large force behind the transformation and disruption of the banking industry. Their distinct habits and preferences will be responsible for reshaping the global economy in the decades to come. 


Millennials are the largest generation in the U.S. and the fastest growing demographic in the world. Organizations and corporations worldwide are trying to figure out how to engage this generation whose brand relationships and patterns of consumption are distinctive from those of generations past. Young people think differently, consume differently and use traditional services differently. Companies who successfully unlock the keys to the habits of Millennials will reap major profits.

The banking space has felt the effects of this more than any other industry to date. It is pretty safe to say that millennials hate traditional banking. The Millennial Disruption Index is a three-year study based on extensive interviews with over 10,000 respondents who answered questions about which industries were most likely to be disrupted in the coming decades. Key findings include:

  • Millennials believe banking is at the highest risk of disruption out of all the industries in the survey.
  • 53% think their banks offer nothing different from other banks.
  • 71% would prefer to go to a dentist than listen to what banks are saying.
  • 1 in 3 are open to switching banks in the next 90 days.
  • Four leading banks — JP Morgan, Citibank, Bank of America and Wells Fargo — are among their least favorite brands.

They also have big ideas on the future of money and finance:

  • 68% believe accessing money will be different in five years.
  • 70% believe paying for things will be different in five years.
  • 33% believe banks aren’t needed at all.
  • 50% believe startups will change the way banks works.
  • 73% would be more excited about a new offering in financial services from Google, Apple, Amazon, Paypal and Square than a nationwide bank.

It’s no wonder that banks may feel threatened and that the executives at these banks believe they could be facing increasing profit-margin pressure and outright disintermediation, as highlighted in a recent Accenture report.


Demographics and Characteristics

Goldman Sachs put out a report on the demographics and characteristics of the Millennials titled “Millennials Coming of Age.” Millennials were born between the years 1980 and 2000 and are considered the largest generation in American history at 92 million. For comparison, Generation X has 61 million and the Baby Boomers have 77 million.

Goldman recognizes five defining characteristics of this generation:

  1. They are the first digital natives — the first generation that has grown up fully connected to smartphones and the Internet.
  2. They have use social media in a profound way and are completely “connected.”
  3. They have less money to spend.


4. They are encumbered in debt, mostly in the form of student loans.

5. They have different priorities. Owning a home and getting married are not very high, mainly due to lower incomes and increasing debt.

As a result, Millennials use technology differently, especially financial technology. People who carry huge debts and make and save less money can’t get traditional loans and don’t have the same access to capital markets as generations past. They have poor credit. All this shapes their buying decisions and how they look at the future, particularly in relation to home ownership, getting married and having children.

Companies like Lending Club have taken off because they provide peer-to-peer lending for those left out of the banking system. Peer to peer in finance is just a natural extension of the “sharing economy” which has shaped the way Millennials think. They are looking for access, not ownership. This generation is reluctant to buy and own goods. Think Uber and AirBnb, for example. 

Traditional asset management is also changing due to other Millennial values: low fees and transparency. Companies such as Betterment, Wealthfront, Stockspot and Robinhood have stepped in to offer services for free, or at very low rates, allowing anyone access to owning many different varieties of assets.

Platforms like AngelList, SeedInvest and Fundersclub are allowing people to invest in private companies and startups in a way that has never been done before. Realty Mogul is an example ofcrowdfunding for real estate.

The emergence of these FinTech companies happened in the wake of the Great Recession, as investment behaviors were dramatically altered. For example, Millennials who have money keep 52% in cash and 28% in stocks, whereas older people keep 23% in cash and 46% in stocks, according to a UBS survey.

Millennials blame banks (rightly so) for the 2008 crisis that left them scarred and underemployed, while saddled with huge debts. The banking scandals that have gone unprosecuted has also led to young people’s ire against traditional banking. The list includes Libor, the “London Whale”, the PPI Scandal, money laundering scandals, and the list goes on and on.

This has given rise to challenger banks, which are defined as ones that provide competition to the traditional banks. Examples include Virgin Money, Metro, Aldermore, Shawbrook and Paragon. BankMobile may be the beginning of the future for banking. It has no physical presence (it’s mobile only), and its transaction fees are zero.  All this has also coincided with the rise of digital currencies like Bitcoin and the transformation of assets, in general, to the digital space.

Elite Daily Study: Findings on the Millennial Consumer

Elite Daily did a study on the enigmatic Millennial consumer habits. Companies that want to tap into the largest generation ever should be making its findings a part of their strategy for customer acquisition. Some of the key findings:

  1. Millennials aren’t influenced by advertising.
  2. They review blogs before making purchases.
  3. They value authenticity as more important than content.
  4. They want to engage with brands on social networks.
  5. They want to co-create products with companies.
  6. They use multiple tech devices.
  7. They expect brands and corporations to give back to society.

Traditional banking seems oblivious about trying to draw this generation in, and this is a good thing. As more and more products and services are shaped for these new consumers, society as a whole will benefit. Lower fees, quicker payments and settlements, more transparency, more options, and most importantly more access to the financial system for everyone.

You can also check out adetailed presentation here.

May 23, 2015 /George Samman
Comment

Bitcoin Price Analysis: A Big Move Looks Imminent (Week of May 17)

May 17, 2015 by George Samman


Price at the time this article was written is: US$235.69

Last week the article began with:

“The indicators continue to remain in neutral territory. This move still appears to have limited upside and appears to be topping out as volume and momentum have not followed the price higher and many of the indicators have flattened out.

While there have been some improvements in price in the short term, nothing has changed as far as the long-term trend goes. The price broke through 240 only to come back down and now sits right below the 50-day EMA, which once again is proving to be big resistance. If price were able to break above and hold right, 250-255 looks like it would be the top of this move.  The weight of the evidence says this move should not be trusted and is nothing more than a countertrend rally. This could change if the indicators and volume were to confirm an upward price move.”

This continues to be the case. The price had a move to break nicely above the 50 day EMA but could not hold and has since retracted. The trading range continues to get tighter and a move should be expected very soon one way or the other.

More good news has continued to come in and not much in the way of bad news (Nasdaq OMX using the bitcoin blockchain, and others looking to use the technology including Honduras), and yet the price continues to be less and less reactive. 

The good news continues to be discounted, which generally isn’t indicative of a move higher. On the other hand, there’s an old adage which applies here:

“Never short a dull market.” 

Resolution of this range should come soon and it could be a big move since there is less and less on-exchange liquidity in recent months.

Technically we are pretty much in the same place with perhaps a more bearish leaning slant since price is having so much difficulty staying above its 50 day EMA (Estimated Moving Average). As has been mentioned in previous articles, the slope of all the EMAs (50, 100, and 200) is sloping downward, however they are sloping less so. The 50 and 100 day EMA’s are starting to tighten as well. This all is setting up for a move.

Long-Term

The 1-year chart (long-term) for bitcoin remains bearish. Price continues to be range bound. The price remains below all 3 of its EMAs. The 50 day EMA is still proving to be a major resistance area at approximately ~US$237.  Price has been rejecting higher levels for a few weeks now.

As mentioned above, the slopes of all 3 EMAs are bending downwards as well. Moving Average Compression is also starting to happen and, if it continues, this will set off a move in the price. This is a condition that occurs as the EMAs start to tighten, which the 50 and 100 day EMAs are currently doing. This happens as the variance between the moving averages (highest and lowest) decreases leading to decisive movements in price one way or the other. 

Bollinger Bands have also been added and they are tightening as well. This happens when volatility declines as it has in the bitcoin price. Thus, another indicator of a potential move is when these Bollinger Bands continue to tighten and coil. This is similar to pressing down on a spring until it eventually recoils.

The Money Flow Index (MFI) and the Relative Strength Index (RSI) continue to be relatively flat and at neutral levels, although they are starting to turn downwards. Momentum is waning and a lot of energy has been expended trying to get above the 50 day EMA. There doesn’t appear to be much more strength left.  Also note that the MACD is sitting on the zero line and has essentially remained flat for an extended period. All of this has happened on very low volume. These are not signs of a trend change.


- Ichimoku Clouds

The 1-year Ichimoku (cloud chart) essentially remains the same. Price has entered the bottom of the cloud and continues to stay near the lower bound of the cloud. ~US$230 is now providing some support for the price.

When looking at the clouds, it’s important to remember which direction price enters the cloud from. Since it entered from below, the cloud should continue to be resistance for the price and the ~US$255 (which is the top of the cloud) will be a major test if price ever gets there. Since it entered from below, we should be on guard that it will be a continuation of a pattern lower.

The cloud ahead in the future is becoming more neutral and flattening out. It has also attempted to make a bullish crossover, which has been rejected thus far. For now there isn’t much of a signal to take from this, except a continuation of the trading we have seen lately.

Aside from the price below the cloud, the Chikou Span (Lagging Line) is below the cloud, along with the Tankan Sen (Conversion Line) and the Kijun Sen (Base Line). The Tankan Sen and the Kijun Sen have pierced the cloud but are also dragging down the lower bounds. While it’s positive that they have entered the cloud, there doesn’t appear to be enough momentum behind this move to propel them higher.

We are still range bound and watching for a break below or above the cloud is what one should be looking for to gauge a trend. For further definitions of what is being discussed, please refer to this previous post on Ichimoku cloud charts.


Intermediate-Term Trend

Using Fibonacci retracements from an intermediate-term price high of US$427 recorded back in mid-November, we see that the price is above the support at ~US$230. This is becoming a big area on multiple time frames and using different technical indicators.

Having failed (yet again) to break above resistance (50 day EMA) and hold, a test of US$230 is likely. If it falls below this level, there are some minor support levels below but the US$210-215 looks like it will provide major support.

The RSI and MACD are both flat and appear to be topping out. This continues to show that momentum is stalling.

Included is the Directional Movement Index (DMI), which looks at buying and selling pressures. The blue line indicates buying pressure, the red line indicates selling pressure and the orange line is the ADX, which indicates the strength or weakness of a trend. 

As one can see, selling pressure has fallen with the ADX line indicating selling pressure has receded in the last few weeks. Buying Pressure and Selling Pressure continue to fall and are both below the ADX. This is yet another sign that momentum has topped out and price is range bound on very small volume. This is happening at low levels, which means volume and momentum are not confirming the higher move that occurred to the top of the price range. This again confirms that price is getting ready to make a move one way or the other.

Bollinger bands are confirming this too. All the indicators and time frames are showing this squeeze. A resolution should come within days.


Short-Term Trend

Looking at the short-term trend (May 9 price high of ~US$247) using Fibonacci retracements, it looks to have topped out at ~US$247 where it couldn’t hold above the 50-day EMA and now appears to be heading lower.

A big base has formed and US$235 level is now providing support. This needs to hold otherwise a test of that ~US$231 level will happen imminently. This area is becoming more and more important. Short term, US$235 and US$231 are really big areas. If these should break down the US$225 and US$221 come into play, but will probably be stops on the way to testing the ~US$210 level. The RSI and Money Flow are both heading down confirming the price. MACD could not be more flat at the zero line.


Big move imminent

The primary downtrend continues. It’s looking like the price is getting ready to make a big move. All of the indicators are compressing around the same key levels mentioned above.

The price has moved lower this week and some big support areas need to hold. Momentum and volume are at low levels. The 50-day EMA continues to be very big resistance as price has continuously failed to stay above it. It still looks like there are lower levels to be tested. Every rally in price in recent months has been at lower levels and this latest one demonstrates that point. A retest of the ~US$210 area continues to look like a real possibility.

May 17, 2015 /George Samman
Comment

First Cracks Appear in Central Banking Gone Wild

May 15, 2015 by George Samman


Central bank policy and regulations have made the markets illiquid. This combined with herd-mentality trading will have a negative impact on the economy when markets start re-pricing assets based on different valuation scenarios, which can happen unexpectedly and very quickly. Thus, the inevitable asset price correction and adjustment to new levels will be very painful in the near future.

Price instability

The global markets have a liquidity problem. This is evident from the rapid swings in equities, commodities (oil in particular), FX and most notably the bond markets. There have been notable “air pockets” in price, as labeled by traders. These are areas where slippage occurs. Slippage can be defined as the expected price of a trade and the price the trade actually occurs at. It usually happens in highly volatile or illiquid markets.

At a time where global central banks have been easing for years and have pinned interest rates at near zero or even negative as well as engaged in unprecedented Quantitative Easing (QE) programs, this should not be happening.

Chief Executive of the Institute of International Finance (IIF), Tim Adams, recently stated that liquidity has been determined as the top issue in the meetings he’s had with central bankers, CEOs, and financial institutions.

Misconceptions about Liquidity

In a recent memo, famed hedge fund manager Howard Marks of Oaktree Capital succinctly addressed misconceptions about liquidity and what the important definition of liquidity is.

“But the more important definition of liquidity is this one from Investopedia: ‘the degree to which an asset or security can be bought or sold in the market without affecting the asset’s price,’” said Marks. He added:

“Thus the key criterion isn’t ‘can you sell it?’ It’s ‘can you sell it at a price equal or close to the last price?’  […] For them to be truly liquid in this latter sense, one has to be able to move them promptly and without the imposition of a material discount.”

The chart below shows what happens in a market that has high money liquidity propagated by central bank policies accompanied with low trading liquidity. Events of +/- 4 standard deviations at one time were extremely rare, but since the end of the global financial crisis and the beginning of central bank intervention, a different picture has emerged amongst all asset classes.


Reasons for Illiquidity

The main reason cited for the liquidity problem is very harsh regulations that have been imposed, which have made it almost impossible for traditional and investment banking to play its classic market-making role. The market maker’s exact role is to provide liquidity to marketsparticularly in times when no one else will.

In light of the regulations, those who once filled this role are holding way less inventory than they used to. Chief Economic Advisor, Mohamed El Erian, states:

“Tighter regulations and less patient shareholders have restricted the ability of broker-dealers to deploy their balance sheets counter-cyclically. As such, they have limited appetite when it comes to accumulating inventory in the event that a large chunk of the investor base decides to go the other way. The result has been a series of sudden out-sized price moves in quite a range of markets, from sovereign bonds to foreign exchange, emerging markets, and high-yield corporates. Fortunately, due to the stance of central banks, most of these episodes have proven -- at least so far -- to be short in duration, temporary and reversible.”

Another reason which has particular significance to the bond market is that in the 8 years corporate bond inventories in the US have dropped by 75% and by 50% in Europe. At the same time, due to the regulations which have been passed, banks are required to hold more bonds on their balance sheets.

The QE by central banks has caused these entities to hold bonds of all timeframes. This has taken a tremendous amount of supply out of the market. The result of this is shown in the chart below when the market moves in one direction without liquidity.


This is a massive move in a very short time.  What this shows is a negative feedback loop, meaning that if traders are positioning themselves for a lack of liquidity, this can further reinforce that lack of liquidity as traders and investors shrink their position sizes and become more cautious and unwilling to take on more risk. In fact, they are likely to hold for shorter time periods and have a quick trigger finger to exit positions due to these so-called “air pockets.”

The Liquidity Paradox

Liquidity paradox is a term coined by Citibank analyst Matt King to explain Central Bank policies of QE and extreme easing, which has herded investors into risky assets to get returns at a better rate than near 0%. According to Citi, this has caused “large scale mismatches in the number of buyers and sellers.” This has resulted in this liquidity paradox:

“[…] because the more liquidity central banks add, the higher the risk of a serious liquidity crunch -  started out in corporate bond markets but is now distorting government bond,currency and share markets. It says while the post-financial crisis crackdown on own-account trading by investment houses was partly to blame for a decline in professional market-making, the increased difficulty of finding buyers because everyone is selling at once owes more to central banks' hold on financial markets since the crisis.”

These policies have led to distortions in the capital markets and most people investing in the same way (herd-like investing), which has exacerbated the liquidity problem. Unwinding these trades is going to be problematic due to the massive one-sided trading.

Dornbusch’s Law

"The crisis takes a longer time coming than you think, and then it happens faster than you thought it would."

- Dornbusch’s Law

In other words, Dornbusch’s Law states that financial crises take a lot longer to arrive than one would think and then pass much faster than expected. So you have a chance to be wrong twice.

While everyone thought the collapse of global economies would bring on the next crisis, what if the boom-bust cycle isn't what's going to cause the next crisis, but recognition that 2009 is behind us and zero interest rates awash with money liquidity are distorting asset class prices?

A great re-pricing in interest rates (higher) in an illiquid market could send shockwaves to all asset classes.

If this recovery happens faster and the central banks do what they do best - which is being reactive rather than proactive - interest rates will spike and choke off a nascent recovery roiling the markets because everyone is wrong-footed. Thus, people might actually have to invest again and not wait for “the Fed Minutes.”


May 15, 2015 /George Samman
1 Comment

Bitcoin Price Analysis (Week of May 11): Topping out around the 50-day EMA​

May 11, 2015 by George Samman


Price at the time this article was written is: US$238.38

Last week the article began with:

“The Bitcoin  price continues to be range bound. This appears to be looking like the top of that range.  Last week the price was ~$225 USD as of this writing and now its at $238 USD.  It has attempted a few times to get above $240 USD, which is proving to be major resistance.  This is where the 50-day exponential moving average now lies. In the last few days price has tried to stay above this level and hasn’t been able to.”

There has been quite a bit of good news lately (itBitCT r:  25 fully regulated, Goldman SachsInvestment in Circle, GBTC now trading) and yet the price reacts less and less to it.  Price continues to get faded at lower levels. When good news continues to be discounted this is another bearish sign.

Technically not much has changed.  As has been mentioned in previous articles the slope of all the EMAs (50, 100, and 200) is sloping downward. Price is having trouble holding above the 50 day EMA.  The best case scenario would be to see a flattening out of the moving averages as a sign of improvement. However, this has not happened yet.

The indicators continue to remain in neutral territory. This move still appears to have limited upside and appears to be topping out as volume and momentum have not followed the price higher and many of the indicators have flattened out.

While there have been some improvements in price in the short term, nothing has changed as far as the long-term trend goes. The price broke through 240 only to come back down and now sits right below the 50-day EMA, which once again is proving to be big resistance. If price were able to break above and hold right, 250-255 looks like it would be the top of this move.  The weight of the evidence says this move should not be trusted and is nothing more than a countertrend rally.  This could change if the indicators and volume were to confirm an upward price move.

Long-Term

The 1-year chart (long-term) of Bitcoin remains bearish. Price continues to be range bound. The price remains below all 3 of its Exponential Moving Averages (EMAs). The 50-day EMA is proving to be a major resistance area and right now, that is approximately at ~US$240.  Price has not been able to stay above it in recent days.

As mentioned above, the slopes of all 3 EMAs are bending downwards as well. This is symptomatic of falling prices that are not ready to rise and if they can continue to slope downwards, the price will follow, which can lead to an accelerated downtrend.

The Money Flow Index (MFI) and the Relative Strength Index (RSI) both are following the same pattern they have risen to neutral levels and have now flattened out and are looking like they are beginning to turn downwards. Simply put, momentum is beginning to wane and this move doesn’t seem to appear to have much more strength in it.  Also note that the MACD is sitting on the zero line and has essentially remained flat. These are not signs of a trend change.


-- Ichimoku Clouds

The 1-year Ichimoku (cloud chart) continues to confirm this bearish scenario, even though it’s becoming more neutral.  Price has entered the bottom of the cloud ever so slightly and this conforms to the 50-day EMA as resistance. It did not burst in with volume so it may not hold for very long.

The cloud is major resistance and it confirms the ~US$255 area as the potential upper top of this move if the price were to get there. 

The cloud ahead in the future continues to flash a warning sign. It is 26 days ahead in the future and is future resistance and it currently lies at ~US$228. This is below the current price which means something has to give and in this case it looks like price will confirm this move and head lower. That cloud had a bearish crossover a couple of weeks ago and continues to predict lower prices in the future. The cloud continues to descend providing additional pressure on the price.

Aside from the price below the cloud, the Chikou Span (Lagging Line) is below the cloud, along with the Tankan Sen (Conversion Line) and the Kijun Sen (Base Line). Crossing into the cloud and above it would be a positive sign but this has not occurred yet.  The Tankan Sen and Kijun Sen lines have crossed underneath the cloud which is a positive signal but it’s still wait-and-see on whether price confirms.

Meanwhile, nothing in the Ichimoku chart shows signs of an imminent reversal but it is time to be vigilant and see what transpires in the coming days. For further definitions of what is being discussed, please refer to this previous post on Ichimoku cloud charts.


Intermediate-Term Trend

Using Fibonacci retracements from an intermediate-term price high of US$427 recorded back in mid-November, we see that the price is above .236 support at ~US$231.  If it breaks below this, the downside scenarios mentioned below would take place.  As of this writing price is ~US$238.  Having failed (yet again) to break above resistance and hold US$240 a test of US$231 is likely.

The US$210 level continues to be major support and should be retested. The RSI and MACD are both flat and appear to be topping out.  This continues to show that momentum is stalling.

I have also added the Directional Movement Index (DMI), which looks at buying and selling pressures. The blue line indicates buying pressure, the red line indicates selling pressure and the orange line is the ADX, which indicates the strength or weakness of a trend. 

As one can see, selling pressure has fallen as has the ADX line indicating selling pressure has receded in the last few weeks.  The Blue Line (buying pressure) crossed over selling pressure last week, but is pointed downward along with selling pressure and the ADX.  This indicates momentum is petering out and that the price may continue range-bound and directionless on very small volume. This is happening at low levels which means volume and momentum are not confirming the higher move that occurred to the top of the price range.


Short-Term Trend

Looking at the short-term trend (May 9 price high of ~US$247) using Fibonacci retracements, the short-term price trend looks to have topped out at ~US$247 where it couldn’t hold above the 50-day EMA and now appears to be heading lower.

Short term US$236, US$233 and US$231 are support areas which look like they will be tested. If these should break down US$225 and US$221 come into play.  The RSI and MACD are both heading down confirming the price. The ~US$210 area should provide support if price breaks below the targeted areas mentioned above.


The primary downtrend continues.  While prices have moved higher, it appears to be the top of the range and most indicators are confirming this. Momentum and volume have not followed price higher. The 50-day EMA continues to be very big resistance as price has failed to stay above it.  If price does move higher, be suspicious.  It still looks like there are lower levels to be tested. Every rally in price in recent months has been at lower levels and this latest one demonstrates that point.  A retest of the ~US$210 area looks like a real possibility.

May 11, 2015 /George Samman
Comment

Inflation, Negative Interest Rates and the ‘New Normal’

May 09, 2015 by George Samman


Global interest rates are at their lowest levels in decades. This has baffled many leading economists and global fund managers. The discussion centers around deflation and the “new normal,” which has been a period defined as slow global growth and very low returns.

But is this just a temporary speed bump on the road to economic recovery and rates will begin to rise as this becomes apparent? And why has no inflation been created despite the massive global easing cycle created by every central bank in the developed world?

In a 4-part blog series, Former Federal Reserve Chairman Bernanke has explained why he believes interest rates are so low the world over.  In some European countries, most notablySwitzerland, Denmark, Germany, Finland, the Netherlands, and Austria have had or do have negative interest rates. 

Presently, more than 2 trillion Euro worth of Eurozone government bonds trade at a negative interest rate. This comes out to more than 30% of all government debt in the Eurozone. In certain countries the statistics are even more stark. For example, in Germany, 70 percent of all German bonds now trade at a negative yield; in France it is 50%.

The chart below shows the trajectory of global 10 year bond yields since 1990:


Negative interest rates

Negative interest rates are when you give the bank or government some form of money, and over time these entities will give you back less money than what you initially deposited. For more on this please refer to my interview with Professor Miles Kimball on negative interest rates.

Essentially, the depositors are paying a bank or government to take care of their money. This is the result of a flight to safety for people who are extremely risk averse, and this typically happens on the heels of a massive recession in places where there is little to no growth (e.g. the EU). 

The motivation behind this from a central bank perspective is to get businesses in particular to take loans and finance operations very cheaply in an effort to stimulate an ailing economy. A side effect is that savers are punished greatly and are exposed to risk in an effort to find yield and returns, which, in theory, is also expected to boost economic activity through the wealth effect.

Quantitative Easing (QE) by global central banks has also been responsible for the suppression of interest rates as well, which has had the same effect on risk appetite.

Inflation Expectations

It’s important to understand Bernanke’s reasoning because current Chairwoman Janet Yellen’s Fed Policy is based on its predecessor: the Bernanke Fed. The parlance for this is “Fed watching” and this is done by many in the financial sphere to get a read on capital markets based on the actions of the Federal Reserve.

Bernanke explains that low interest rates can partly be explained by the rise and fall in the rate ofinflation. The reason for this is simple: when inflation is high, investors want higher yields “to compensate them for the declining purchasing power of the dollars with which they wish to be repaid.”

In other words, inflation expectations affect interest rates as the chart below shows:


It is well known that the Fed is the primary determinant of short-term interest rates. This is one of the monetary tools the Fed has at its disposal and Bernanke candidly admits that Fed policy can also influence inflation and inflation expectations (allegedly) over the longer term (10-30 years).  He argues that this matters not and that real interest rate is the one matters from a capital investment standpoint, which is inflation adjusted (market interest rate- inflation rate. However, the Fed doesn’t control the real interest rate (Bernanke’s opinion), what does are: growth prospects for and real growth within the economy. 

What the Fed does is use its best estimate to find an equilibrium rate (or in plain speak “guess”) so as not to choke off economic growth or recovery on one side, and on the other side make sure the economy does not overheat and crash. 

This is balancing inflation and deflation, which in recent history, the Fed has not “estimated” right. According to Bernanke:

“[T]he Fed cannot somehow […] leave interest rates to be determined by ‘the markets.’ The Fed’s actions determine the money supply and thus short-term interest rates; it has no choice but to set the short-term interest rate somewhere. So where should that be?” 

Therefore, his answer is to set it at the equilibrium rate, whatever that equilibrium might be.

Secular Stagnation

The US Federal Reserve has 2 mandates:

  1. to achieve full employment (a number they determine); 
  2. keep inflation rates low and stable (2% is the target rate here).

Despite all the monetary tools at the Fed’s disposal the inflation target rate has not been achieved as the chart below shows.


Bernanke believes this is due to slow economic growth, low inflation, and low real interest rates, which generally defines secular stagnation. Yet, he believes that this is not so. Larry Summersstates that “the essence of secular stagnation is a chronic excess of saving over investment.”

As this chart shows and Bernanke states since there is a Zero Limit Band on interest rates (insert definition here) meaning nominal interest rates can not fall below zero and real interest rates can not fall below -2. 

Bernanke seems to think that negative interest rates are a temporary phenomenon, which can be properly managed without causing giant misallocations of capital for the reasons noted in the beginning of this article. 

His argument is that secular stagnation can’t just occur in one country but can only occur if there are low returns globally. In other words, money will go where it needs to find returns and that there are places in the world where proper returns can be achieved. Perhaps this could work when the entire planet is involved in a giant easing cycle, but time will tell if that is enough to jumpstart the global economy.

The Global Savings Glut

Bernanke cites the “global saving glut” as another reason for low interest rates. This is determined by global flows of savings and investment. He stated:

“My conclusion was that a global excess of desired saving over desired investment, emanating in large part from China and other Asian emerging market economies and oil producers like Saudi Arabia, was a major reason for low global interest rates.”

This glut, according to Bernanke is caused by government policy decisions. Bernanke believes that these policies should be reversed so as to cause savings to be put into investments.

Referencing China’s move away from an export economy and the continued buildup of foreign reserves in Asia as well as low oil prices, Bernanke notes that this has put global savings into a downward trend, which is a cause for optimism. He also added that the international community should oppose countries whose national policies promote current account surpluses.

Term Premiums

Lastly, Bernanke looks at longer term interest rates to understand why interest rates are so low worldwide. According to Bernanke, there are three components which determine yield:

  1. expected inflation;
  2. expectations about the future path of short term interest rates;
  3. a term premium.

As has been stated, the first two components are expected to remain low due to low expectations of global growth. Since short term rates are expected to remain low, Bernanke believes this causes longer term rates to come down as well.

Bernanke focuses on term premiums in the 4th part of this series and defines them as “the extra return lenders demand to hold a longer-term bond instead of investing in a series of shorter term securities.” Due to time risk, (the cost of holding longer term bonds) longer term yields usually pay more than short term yields, which means their term premiums are higher. 

There are 2 key determinants of term premiums:

  1. changes in the perceived risk of longer term securities (yields have been coming down due to a perception of less inflation risk);
  2. changes in the demand for specific securities (investors have been buying more longer term bonds so price has gone up and yields have come down) relative to their supply. 

As the chart below shows, this has caused yields and term premiums to both come down. With low inflation, low inflation expectations and global easing this is what should be happeningaccording to the former Chairman.


Bernanke:

“The low level of term premiums in turn reflects a number of factors including: minimal investor concern about inflation; relatively low uncertainty about the likely future course of interest rates, a strong global demand for safe, liquid assets; and quantitative easing programs by central banks.”

Conclusion

The question is should we believe Chairman Bernanke that this is just a temporary headwind on the road to global recovery or have we reached a longer period of slower growth and economic malaise?

A funny thing about expectations, especially ones where the Fed and most investors are positioned on the same side, is that they usually have unexpected results. Surprises happen all the time. The Central Bank has a history of fueling bubbles with loose monetary policy and leaving interest rates at low levels for too long so why should this time be any different?

There have been enormous misallocations of capital caused by non-stop global easing for years alongside negative to low interest rates. If economic malaise continues, rates should remain low and negative on a global scale.

But if Bernanke is right and the economy is about to turn the corner, the low expectations of inflation combined with monetary irresponsibility could bring about unintended consequences, such as a pick up in inflation faster than anyone thought possible, which would stonewall a global recovery and usher in the next recession.


May 09, 2015 /George Samman
Comment

Bitcoin Price Analysis: The 50 Day Exponential Moving Average is Big Resistance (Week of May 4)

May 04, 2015 by George Samman


he Bitcoin  price continues to be range-bound. This appears to be looking like the top of that range.  Last week the price was ~$225 USD as of this writing and now its at $234 USD.  It has attempted a few times to get above $240 USD, which is proving to be major resistance.  This is where the 50-day exponential moving average (insert link) now lies. In the last few days price has tried to stay above this level and hasn’t been able to.

As has been mentioned in previous articles the slope of all the EMAs (50, 100, and 200) has turned downward and this is starting to prove problematic. The price is having trouble holding above these lines.  The best case scenario would be to see a flattening out of the moving averages as a sign of improvement, this has not happened thus far.

While many indicators have moved into neutral territory this move appears to be topping out as volume and momentum have not followed the price higher and many of the indicators appear to be topping out.

While there have been some improvements in price short term, nothing has changed as far as the long-term trend goes.  If the price were to break through 240 and continue higher 250-255 would be the top.  The weight of the evidence says this move should not be trusted and is nothing more than a counter trend rally. 

Long-Term

The 1-year chart (long term) of Bitcoin remains bearish. The price continues to decline, and remains below all 3 of its Exponential Moving Averages (EMAs). The 50-day EMA is proving to be a major resistance area and right now, that is approximately at ~US$241. The price has not been able to stay above it in recent days.

As mentioned above, the slopes of all 3 EMA’s are bending downwards as well. This is symptomatic of falling prices that are not ready to rise and if they can continue to slope downwards, the price will follow, which can lead to an accelerated downtrend.

The Money Flow Index (MFI) and the Relative Strength Index (RSI) both are following the same pattern they have risen to neutral levels and have now flattened out and are looking like they are beginning to turn downwards. Simply put, momentum is beginning to wane and this move doesn’t seem to appear to have much more strength in it.  Also note that the MACD has been below zero for this entire move and has essentially remained flat. These are not signs of a trend change.


- "ICHIMOKU"

Not much has changed in the Ichimoku charts. The 1-year Ichimoku (cloud charts) continues confirming this bearish scenario.

The price is below the cloud, which is bearish. The cloud is major resistance and it confirms the ~$255 USD area as the potential upper top of this move if price were to get there. 

What continues to be disturbing is the cloud in front of the price, which is 26 days ahead in the future. It is future resistance and it is at ~US$228. This is below the current price which means something has to give and in this case it looks like the price will conform to this move and head lower. That cloud had a bearish crossover a couple of weeks ago and continues to predict lower prices in the future. The cloud continues to descend providing additional pressure on the price.

Aside from the price below the cloud, the Chikou Span (Lagging Line) is below the cloud, along with the Tankan Sen (Conversion Line) and the Kijun Sen (Base Line), which are sloped downward but are flattening now. It appears they too are topping out in this current rally. 

Meanwhile, nothing in the Ichimoku chart shows signs of an imminent reversal. For further definitions of what is being discussed, please refer to this previous post on Ichimoku cloud charts.


Intermediate-Term Trend

Using Fibonacci retracements from an intermediate-term price high of US$427 recorded in mid-November, we see that the price is above .236 support at ~USD $231.  If it breaks below this, the downside scenarios mentioned below would take place.  As of this writing price is ~$234 USD.  Having failed to break above resistance and hold $240 USD a test of$231 is likely.

The US$210 level continues to be major support and should be retested. The RSI and MACD are both flat and appear to be topping out.  This shows momentum is stalling.

I have also added the Directional Movement Index (DMI), which looks at buying and selling pressures. The blue line indicates buying pressure, the red line indicates selling pressure and the orange line is the ADX, which indicates the strength or weakness of a trend. 

As one can see, selling pressure has fallen as has the ADX line.  This indicates selling pressure has receded in the most recent week.  The Blue Line (buying pressure) has crossed over selling pressure, which is indicative of a move higher in price.  This is all happening at a low level in the index which means volume and momentum are not confirming the higher move to the top of the range in price. This index has turned positive but at very low levels. Simply put this means this indicator should be watched but not used as a signal.


Short-Term Trend

Looking at the short-term trend (May 4 price high of ~$241 USD) using Fibonacci retracements, the short-term price trend looks to have topped out at~$241 USD which again happens to coincide with the 50 day EMA.

Short term $235 and $231 are both support areas which look likely to be tested. If these should break down $228, $225 and $221 come into play.  The RSI and MACD are both showing that ~$241 looks like it was the top as they have both headed downward.

The ~210 area should provide support if price breaks below the targeted areas mentioned above.


The primary downtrend continues.  While prices have moved higher, it appears to be the top of the range and most indicators are confirming this. Momentum and volume have not followed the price higher. The 50-day EMA looks to be fairly big resistance as the price has failed to stay above it.  If the price does move higher, be suspicious.  It still looks like there are lower levels to be tested. Every rally in price in recent months has been at lower levels and this is a concern as well.  A retest of the ~$210 area looks like a real possibility.

May 04, 2015 /George Samman
Comment

Bitcoin Price Analysis: Range Bound Within Continuous Downtrend (Week of APR 26)

April 26, 2015 by George Samman

The Bitcoin  price continues its long steady decline, but has been range bound within a larger decline. This has been a tricky place as the price has whipsawed around. This happens when price heads in one direction, but then is followed quickly by a movement in the opposite direction.

The price started the week at US$224 and while we expected the price to go down and test the US$210 and then US$200 levels, it instead went up to US$240, breaking through some minor resistance levels before heading back down and hitting near our $210 level, where it has bounced off support and is, at the time of writing, at US$225.

Nothing has changed as far as the trend goes: Bitcoin remains in a primary downtrend. The rallies are getting weaker and it is still our belief that the US$200 level will be tested and if it does not hold, the lows of $152 will come into play.

Long-Term

The 1-year chart (long-term) of Bitcoin remains bearish. The price continues to decline, and remains below all 3 of its Exponential Moving Averages (EMAs). The 50-day EMA will continue to be a major resistance area and right now, that is approximately at ~US$242.

Also note that the slopes of all 3 EMAs are bending downwards as well. This is symptomatic of falling prices that are not ready to rise and if they can continue to slope downwards, the price will follow, which can lead to an accelerated downtrend.

Interestingly, the MFI has turned up and is diverging from price and RSI and MACD. The RSI remains flat to down, which doesn’t show much strength or conviction that the price will move up, and the MACD is relatively flat below 0 confirming this view.

This is common of range-bound trading. The price is exhibiting very little signs of strength and for now, the signs of weakening have abated. In other words, this is no man’s land.


-- ICHIMOKU

Not much has changed in the Ichimoku charts. The 1-year Ichimoku (cloud chart) continues confirming this bearish scenario.

The price is below the cloud, which is bearish. The cloud is resistance and the lower bound of the cloud is at ~US$257.

What is more disturbing is the cloud in front of the price, which is 26 days in the future. It is future resistance and it is at ~US$228. That cloud had a bearish crossover and is predicting lower prices in the future. The cloud continues to descend, pressuring the price.

Aside from the price below the cloud, the Chikou Span (Lagging Line) is below the cloud, along with the Tankan Sen (Conversion Line) and the Kijun Sen (Base Line), which are steeply sloped downward, confirming the bearish price outlook.

Meanwhile, nothing in the Ichimoku chart shows signs of an imminent reversal. For further definitions of what is being discussed, please refer to this previous post on Ichimoku cloud charts.


Intermediate-Term Trend

Using Fibonacci retracements from an intermediate-term price high of US$427 recorded in mid-November, we see that the price is right below resistance at ~USD $231.

The US$210 level continues to be support and should be retested. The RSI and MACD are both flat and are confirming the aforementioned range-bound trading.

I also have the Directional Movement Index, which looks at buying and selling pressures. The blue line indicates buying pressure, the red line indicates selling pressure and the orange line is the ADX, which indicates the strength or weakness of a trend. 

As one can see, selling pressure is far above buying pressure, but starts to fall, and the ADX is at a high level but begins to flatten out. This continues to show that selling pressure still has the upper hand.

Buying Pressure (the blue line) is beginning to rise from low levels. This is typically what happens in range-bound trading. The Bitcoin price looks like it is getting stuck in this range, waiting to make a move.


Short-Term Trend

Looking at the short-term trend (April 23 high) using Fibonacci retracements, the short-term price trend is finding resistance at the .764 price level of US$231.

If it breaks below US$224, then US$220 and US$216, the short-term low of ~US$210 should provide support after being tested, as it was near the low of the latest move.

If this doesn’t hold, US$200 will certainly be tested. If the price can break above US$228 it could test ~US$231 as well as the short-term high of ~US$238. A higher price is just a countertrend move until proven otherwise and the resumption of the primary downtrend should continue.


The primary downtrend continues in full force. Broken support becomes resistance, meaning that if Bitcoin is to rally, there will be many resistance levels above that which will need to be broken through (Fibonacci levels) along with the moving averages, as well as Ichimoku.

Based on the weight of the evidence my feeling is a test of $200 could come soon.

Bitcoin has entered a period of range-bound trading. Watch key levels before putting a trade in. Right now, the price continues to whipsaw above and below. Be patient and wait for the price to tell you what to do.

April 26, 2015 /George Samman
Comment

Satoshi Broke Software Barriers, ‘Now Everyone Is Doing It’

April 26, 2015 by George Samman


Chris Mountford is a senior software developer at Atlassian and one of the company’s earliest employees. For those who don’t know Atlassian, it is one of Australia’s great success stories.

“BitcoinCT r:  3 shows us that there are a class of things we previously all assumed could simply not be made with software. Money was one of those things. Now we have no idea where our new limits are.”

The company is privately held by its two co-founders Mike Cannon-Brookes and Scott Farquhar, and since its launch in 2002 has grown to over 1,100 employees worldwide and has a current valuation of ~US$4 billion, all without employing salespeople. Essentially, Atlassian makessoftware for technical teams and Mountford has been involved in the development of many of these tools. Some of the more popular ones include Bitbucket, Jira, Hipchat and Confluence. Atlassian has over 22,000 customers globally, including Google, Apple, Amazon, NASA and the United Nations.

Mountford is actively involved in the Australian Bitcoin community and he is the chief evangelist on all things Bitcoin at Atlassian. He will be speaking at Disruptocon, which can be watched onlive stream. CoinTelegraph spoke with Mountford about his involvement in the conference, Atlassian and Bitcoin.

GSS: Can you explain your interest in Bitcoin, as well as that of Atlassian?

Chris Mountford: My interest in Bitcoin is somewhat obsessive. It is the second half of the Internet revolution. I was a passionate and vociferous fanboy of the Internet back in the early ‘90s and what people don't realise is the impact has not yet been fully realised—it's not done yet. 

Software development is my primary focus. I've been a hands-on software developer building products like JIRA at Atlassian since 2005, so my skills are primarily in engineering. Atlassian is a very optimistic and courageous company when it comes to bleeding-edge technology. We recognise the incredible value that comes from investing in knowledge and skills ahead of the curve, and that's a big part of our success in building collaboration tools for technical teams. As far as Atlassian's interest in Bitcoin goes, following our literal "open company, no bullshit" policy, I'll say we do not currently have any official projects to make significant technical contributions in the cryptocurrency software space, but this would change if it makes sense to our business. 

“It's like Roger Bannister being first to run the four-minute mile. He broke the time record, but his achievement is often used to highlight how the toughest barrier to break is our own assumptions of what is possible. Now that Satoshi Nakamoto has done it, everyone is doing it.”


GSS: Are you working on any Bitcoin projects at the moment? If so can you talk about them?

CM: I've worked on Bitcoin and blockchain-related software projects at Atlassian over the past year, but these are mostly prototypes, proof-of-concepts and they're all done through 20% time, self-directed experimental projects and prototypes for ideas my colleagues and I want to explore—bug bounties, adding financial transactions to chat, blockchain-based identity systems. In my copious spare time, I also have an exploratory project to use genetic programming methods for automated crypto trading systems—evolving trading bots. That project is still at an early stage.

GSS: What will you be talking about at Disruptocon?

CM: At Disruptocon, my talk is "Beyond Bitcoin as Money." There's a lot of regulatory discussion about Bitcoin, and it seems to be plagued by the idea that Bitcoin has to be either a commodity or a currency, or some other example of an already existing category of regulatory containment. What's most exciting to me about the blockchain technology is how general purpose it really is. Bitcoin wouldn't be much interest if it was just a digital version of dollars or an incremental improvement over the payments systems we already have. 

“It should require only a monumentally stupid act of self-sabotage to miss out on the FinTech opportunities before us. I'm normally quite optimistic but I have seen no sign from our political leaders that they even understand this point.”


GSS: Based on that phrase, "beyond bitcoin as a currency," can you talk about real use cases you can see that the blockchain can solve?

CM: Bitcoin shows us that there are a class of things we previously all assumed could simply not be made with software. Money was one of those things. Now we have no idea where our new limits are. Certainly all manner of exotic financial instruments, equities, derivatives, futures, etc.—those are all up for grabs. Same too of "smart contracts"— sophisticated multiparty transactions that replace the expensive framework of manual legal executors within regional jurisdictions. Beyond those things there are other nonfinancial types of transactions—identity registration, authorization and reputation systems, provably fair voting, automated real-time auditing, authenticity measures such as "proof of existence," as is traditionally served by the patent system. 

In general, the pattern we are following is to decentralize things and remove extraneous trusted parties from secure interactions. Those human institutions and systems that for hundreds of years have been based on a concentration of authority—centralized systems—many of which can also be built in a decentralized way. There are costs and difficulties in building decentralized systems, but what Bitcoin has shown us is not only that it is achievable, but because, crucially, all this software is open source, we can see exactly how to do it. It's like Roger Bannister being first to run the four-minute mile. He broke the time record, but his achievement is often used to highlight how the toughest barrier to break is our own assumptions of what is possible. Now that Satoshi Nakamoto has done it, everyone is doing it.

GSS: Where do you see Australia fitting into the Bitcoin evolution? Is interest growing here?

CM: Australia is often referred to as the lucky country. This is the century we all find out what we make of that luck. Because we are economically and politically stable with a well-educated and technologically savvy population, and because we are situated in Asia with access to the largest and fastest-growing regional economies in the world, it should require only a monumentally stupid act of self-sabotage to miss out on the FinTech opportunities before us. I'm normally quite optimistic but I have seen no sign from our political leaders that they even understand this point. They seem happy to continue to sell dirt, just as we "rode on the sheep's back" in the past. We should be cutting red tape for value-creating, high-growth industries like software, and build an economically and ecologically sustainable future—we have that opportunity in Australia. 

The mighty USA, by comparison, while it has Silicon Valley and a business-friendly entrepreneurial culture, it is also bogged in a quagmire of state financial regulations that threaten to severely limit its ability to profit from the FinTech surge. The UK, especially the city of London, has acted quickly to capture this potential by untangling the regulatory constraints onBitcoin startups, and providing clarity to enable businesses to comply with a reasonable set of rules. Australia's GST ruling is insane by comparison and is precisely why Melbourne companyCoinJar relocated to London in 2015.

“While a lot of people talk about Bitcoin in the context of a retail experience, or as a high volatility investment, my primary interest is to promote investment in knowledge and skills so that people can achieve a technical and financial literacy to equip them for this kind of future.”

GSS: Are there any further thoughts you want to explore about the space in general?

CM: While Bitcoin is still too new and edgy for a lot of people, especially those who know about it only from mainstream headlines, among early adopters there is a strong consensus that dramatic and transformative technology-driven change in the finance sector is almost upon us. Banks and other financial institutions already know that major divisions of their existing operations will become outmoded and those most able to adapt to rapid change will profit while others suffer. 

While a lot of people talk about Bitcoin in the context of a retail experience, or as a high volatility investment, my primary interest is to promote investment in knowledge and skills so that people can achieve a technical and financial literacy to equip them for this kind of future.

There is an explosion of FinTech projects, distributed systems, cryptographic security solutions to the threat from corrupt surveillance, and monetary systems that are designed to withstand economic crises without entrusting our financial future to anything less reliable than a robust mathematics. And it's all open source. Knowledge is the only barrier to entry. What can we expect? The bottom line is that, even for people deep in the projects to build this future, we are still discovering fundamental possibilities. Our excitement comes from the fact that we will definitely see a lot of new stuff that the rest of us never anticipated.

April 26, 2015 /George Samman
Comment

Mt Gox Depleted of Bitcoins by 2013 Says New Wizsec Report

April 20, 2015 by George Samman


t. Gox had been depleted of most of its bitcoin by 2013 according to a new report from Wizsec, the Tokyo based bitcoin security firm, which has been conducting an ongoing unofficial investigation into Mt Gox’s collapse. 

The theft had been ongoing since 2011 and many of the missing bitcoins were stolen straight out of Mt Gox’s hot wallet.  A significant amount of the stolen bitcoins were deposited at various exchanges like BTC-e, Bitcoinica, Mt Gox itself, and other not yet identified wallets, and subsequently sold for cash.

This led Mt Gox to be operating “knowingly or unknowingly” at fractional reserve since at least 2012. According to the chart below, this left Mt Gox drained of bitcoin way before its filing of bankruptcy in February 2014.


Missing or Stolen?

The report asks the question, “Were the missing Mt Gox bitcoins ever actually real?”  In other words, did Mt Gox ever really hold any of the coins or were they faked deposit entries to make them look real.

Scouring through over 2 million Mt Gox bitcoin addresses as the chart above shows, there was a “clear discrepancy” of hundreds of thousands of bitcoin between the actual and the expected holdings. Moreover, this discrepancy grew over time until by mid 2013 when almost all the bitcoins on Mt Gox were gone.

The next step was to plot the difference between actual and expected Mt Gox bitcoin holdings. This showed that the bitcoins went continuously missing over time, but at a decelerating pace. According to Wizsec, the rate of loss in the chart below “seems unusually smooth.”


-- Plotting Data between Expected and Actual bitcoins

Wizsec matched up most of the deposit/withdrawal log and was able to rule out that the deposits were made up while the bitcoins going in were real. Thus, this discrepancy was being caused by bitcoins that were “leaving without going through valid withdrawals.”

Intentional theft

Wizsec noticed a glaring recurring pattern while scouring through the data:

“MtGox bitcoins would suddenly get sent to a new non-MtGox address, without any withdrawal log entry, often in fairly recognizable amounts of a few hundred BTC at a time. Shortly afterwards, these addresses in turn would get gathered up into bigger addresses holding a few thousand BTC. From there, the coins would get deposited in chunks of some hundred BTC at a time onto various bitcoin exchanges.”


The conclusion was obvious: intentional theft.  Wizsec asks if the majority of the coins were kept in cold storage, then how did they leave Mt Gox?

A theory that emerges is that it was an inside job and the cold storage was compromised “either physically by someone with on-site access, or somehow electronically through some security flaw in the key generation process.”

When Mt. Gox filed for bankruptcy on February 28, 2014, the issued statement read in part:

"We believe that there is a high probability that these bitcoins were stolen as a result of an abuse of this bug. We are looking [at a] variety of causes including hacking by third parties."

The new report concludes by stating the deposited Mt Gox coins were real, definitely stolen, and then sold for cash. This leaves it highly unlikely that any creditors will recover their bitcoins from Mt Gox.  With no definitive answer as to who was behind the theft, Wizsec is continuing the investigation. 


April 20, 2015 /George Samman
Comment

Bitcoin Price Analysis: Steady Downtrend (Week of APR 19)

April 19, 2015 by George Samman


The Bitcoin price continues its long steady decline.

Last week we said:

“Bitcoin price has continued experiencing downside pressure and as of this writing the price looks headed for a retest of the 200 area.  Last week’s recap: If US$240 doesn’t hold, the US$220 area could provide minor support, but U$200 would more likely be an area to watch for bigger support. If it fails to hold, a retest of the lows (US$165-180) will certainly be the next area to watch […].” 

The price proceeded downward as we stated to reach US$210 before it rallied back up above minor support at US$220. As of this writing the price is ~224. Nothing has changed as far as the trend goes, bitcoin remains in a primary downtrend.

Long-Term

The 1 year chart (long term) of bitcoin remains bearish. Price continues to decline.  The price remains below all 3 of its Exponential Moving Averages (EMAs). The 50 day EMA will continue be a major resistance area and right now that is approximately at US$245.

Also note the slopes of all 3 EMA’s are bending downwards as well. This is symptomatic of falling prices that aren’t ready to rise and if they can continue to slope downwards the price will follow, which can lead to an accelerated downtrend.

All 3 indicators are confirming the downward move in price. The RSI and the Money Flow Index along with a declining price and a MACD below 0 are signaling further downside is coming. Simply put the price is exhibiting very little signs of strength.


Ichimoku

The 1 year Ichimoku (cloud charts) continues confirming this bearish scenario. The price is below the cloud, which is bearish. The cloud is resistance and the lower bound of the cloud is atUS$254. What is more disturbing is the cloud in front of the price (which is ahead in the future 26 days). It is future resistance and it is at US$225. The given cloud had a bearish crossover and is predicting lower prices in the future. The cloud continues to descend, pressuring the price.

Aside from the price below the cloud, the Chikou Span (Lagging Line) is below the cloud along with the Tankan Sen (Conversion Line) and the Kijun Sen (Base Line), which are steeply sloped downward confirming the bearish price outlook. Meanwhile, nothing in the Ichimoku chart shows signs of an imminent reversal.


Intermediate-Term Trend

Using Fibonacci retracements from an intermediate term price high of US$429 recorded in mid- November, we see that the price is sitting on support right now at ~US$223 and if this breaks again we will very likely test 200, where it should find some support. If this doesn’t hold the lows are in play. The RSI and MACD are both confirming the likelihood of this event as well. The arrows show the direction.

Also note the Directional Movement Index, which looks at buying and selling pressure. The blue line indicates buying pressure, the red line indicates selling pressure, and the orange line is the ADX, which indicates the strength or weakness of a trend.  As one can see selling pressure is far above buying pressure and the ADX is at a high level, which shows the selling pressure still has the upper hand. The ADX is looking like it may cross over the red (selling pressure line), which may provide some slight ease allowing the price to reach the US$230-235 area, where it will encounter resistance.


Short-term trend

Looking at the short term trend (mid April high) using Fibonacci retracements, the short term price trend is finding resistance at the .764 price level of US$225. If it breaks below US$222, then US$219, US$217 and US$214 should provide minor support before 210, which was the low of the latest move. If this doesn’t hold, US$200 will certainly be tested. If price can break above US$225, it could test ~US$230 before it resumes its downtrend.

Price certainly looks poised for a lower move as the internals are not showing any signs of strengthening.


At the risk of sounding like a broken record, all 3 price trends are bearish right now. Broken support becomes resistance so if bitcoin is to rally, there will be many resistance levels, which will need to be broken through (Fibonacci levels) along with the moving averages, as well as Ichimoku.

For now, looking at those levels isn’t important as the bitcoin price seems to be headed lower and looking for support. If price doesn’t hold in this area we should test US$200 very soon. It’s sit on your hands time. Be patient and wait for the price to tell you what to do.


April 19, 2015 /George Samman
Comment

Bitcoin Price Analysis: Week of April 12 (Bearish Times)

April 13, 2015 by George Samman


Bitcoin price has continued experiencing downside pressure and as of this writing the price looks headed for a retest of the 200 area.  Last week’s recap:

“If US$240 doesn’t hold, the US$220 area could provide minor support, but U$200 would more likely be an area to watch for bigger support. If it fails to hold, a retest of the lows (US$165-180) will certainly be the next area to watch […].” 

Needless to say, US$240 broke. Let’s look at the 3 trends for clues as to what lies ahead.

Long-Term

The 1 year chart (long term) of bitcoin remains bearish. Price continues to decline.  The price remains below all 3 of its Exponential Moving Averages (EMAs). The 50 day EMA will continue be a major resistance area and right now that is approximately at US$255.

All 3 indicators are confirming the downward move in price. The RSI and the Money Flow Index along with a declining price and a MACD rollover below 0 are signaling further downside is coming. 


The 1 year Ichimoku (cloud charts) are confirming this bearish scenario. The price is below the cloud, which is bearish. The cloud is resistance and the lower bound of the cloud is at US$255, which confirms the 50 Day EMA as a place that will hold major resistance.

Aside from the price below the cloud, the Chikou Span (Lagging Line) is below the cloud along with the Tankan Sen (Conversion Line) and the Kijun Sen (Base Line), which are about to roll over and give an even more bearish sign. The cloud in front has also seen a bearish crossover. Meanwhile, nothing in the Ichimoku chart shows signs of an imminent reversal. For further definitions of what is being discussed please refer here.


Intermediate-Term Trend

Using Fibonacci retracements from an intermediate term price high of US$429 recorded in mid- November, we see that the price has broken through all Fibonacci support levels and is likely to test 200, where it should find some support if for no other reason than it’s a big round number. If this doesn’t hold the lows are in play. The RSI and MACD are both confirming the likelihood of this event as well. The arrows show the direction.


Short-term trend

Looking at the short term trend (mid-March high) using Fibonacci retracements, the short term price trend is sitting right on the support as of this writing. If it breaks below 234, 218 is the next minor support area before 200. The short term RSI and MACD as well as Money Flow Index are in a similar decline.

Price certainly looks poised for a lower move as the internals are not showing any signs of strengthening.


All 3 price trends are bearish right now. Broken support becomes resistance so if bitcoin is to rally, there will be many resistance levels above which will need to be broken through (Fibonacci levels) along with the moving averages.

For now, looking at those levels isn’t important as the bitcoin price seems to be headed lower and looking for support. Once price broke through US$240 and all the indicators are continuing to weaken, it’s looking very likely that price will test lower levels as mentioned above. For now, there aren’t many reasons from a trend standpoint to look to initiate buys.

April 13, 2015 /George Samman
Comment

Large Wall Street Firms Look with Increasing Interest Toward Bitcoin

April 12, 2015 by George Samman


While Bitcoin pundits were sure 2014 was going to be the year Wall Street came to Bitcoin, their predictions may have been a year too early. The jury is still out, but signs are growing that large investment firms and other traditional financial services are becoming more interested in trading bitcoin and using its underlying technology.

According to a recent WSJ story, bigger players are becoming more interested in the space. Some of the biggest U.S. proprietary firms and traders are looking towards bitcoin as a speculative vehicle. These firms see an ability to profit from the cryptocurrency, bring liquidity to the market, and help to streamline transactions. Proprietary firms trade with their own money, so they don’t have an investor mandate to follow, which makes it much easier for them to test bitcoin trading.

Among the firms who have shown interest are DRW Holdings LLC from Chicago, who is one of the major investors in Digital Asset Holdings (the firm with which former JP Morgan Executive Blythe Masters is now CEO), Citadel Securities from Chicago, KCG Holdings from New Jersey and Wedbush Morgan based in Los Angeles. All have bought shares in Bitcoin Investment Trust (BIT), which recently started trading on the OTC Markets.

Many firms are staying out of the space because they are still waiting for regulators to finalize the laws that would protect traders and their clients from additional trading risks. From a technological standpoint, the infrastructure will also need to be built further to handle much larger order flows.


Good for Bitcoin

SecondMarket, the company that formed BIT, also won most of the bitcoin in the second U.S. Marshall’s auction. Director Michael Moro has said there are two glaring problems with trading bitcoin for larger players at the moment. “One is that at a $3.5 billion market cap, it is still a small place for traditional large money institutional guys to make markets,” he said. “Two, liquidity is scattered” across various exchanges around the world. 

The hope is that larger players will increase liquidity and bring some stability to price. In other words, the price will become less volatile.  NASDAQ OMX group recently partnered with Noble Markets “to implement Nasdaq's X-stream trading technology for the company's soon to be launched digital currency marketplace.” This is a step toward supporting large firms with big order flows to seamlessly trade bitcoin without suffering from slippage from low liquidity.

BNY Mellon Showing Interest in the Blockchain

In a recent WSJ article, Suresh Kumar, CIO of BNY Mellon stated that his firm is looking into using bitcoin in its existing businesses.  As has been noted in the recent Accenture report, banks use legacy software that is not open source. They also use differing software stacks that are not compatible with new technology, particularly decentralized architecture. 

BNY Mellon is no stranger to this problem and is in the process of trying to figure out how to integrate blockchain technology. As the WSJ put it:

“BNY Mellon senior developer Arun Battu has spent the last several months usingblockchain technology to build an application using open source code from Bitcoin.org. Mr. Battu, who modified the code to run on the bank’s internal network, says his biggest challenge is getting used to the bitcoin architecture. BNY Mellon’s computer systems are largely built on client-server architecture, in which a central server delegates tasks to and provides resources for a network of computers. Bitcoin operates in a peer-to-peer model, in which each computer can act as a server for the others, allowing shared access to files and peripherals.”

Despite the effort and massive overhaul needed to get this done, BNY Mellon sees massive potential in the blockchain for many of its business lines and is willing to test it out. Swiss bank UBS has also announced a similar initiative and is opening a blockchain technology lab in London to explore disrupting the financial payments space.

It appears there is interest in bitcoin and blockchain technology from many different firms in the traditional financial services sector. What is even more interesting is the different ways in which these firms plan to look under the hood of Bitcoin to help their businesses grow.  In the coming months we should find out how interested these firms truly are in this space.


April 12, 2015 /George Samman
Comment

First Fintech-Only Hub Opens in Sydney to ‘Disrupt Banking’

April 08, 2015 by George Samman


The Central Business District (CBD) in Sydney is known for traditional banking and finance. Most of the major institutions are headquartered there. In the heart of this, the Tyro Fintech Hub has opened and its main objective is to work with startups working to disrupt or innovate in finance, banking, or insurance - whether it involves with cryptography, personal finance, data analytics, Bitcoin, or innovative market models such as peer-to-peer.

The Tyro Fintech Hub was opened in February 2015. The Hub takes up the entire third floor of Tyro’s new offices in the newly refurbished art deco building at 155 Clarence Street Sydney.


Fintech boon

In recent weeks, Accenture published a research report showing fintech investment has tripled year over year with no signs of slowing. The report also interviewed 25 executives from traditional financial services who candidly stated that the old model isn’t working anymore and that the rise of fintech will disrupt their businesses. 

Sydney has positioned itself to join London and New York as one of the major fintech cities the world over. While the Tyro Fintech Hub is the first to open that is solely dedicated to fintech, others such as Stone & Chalk will be following in the coming months.

The Tyro Fintech Hub is being headed by Andrew Corbett-Jones, a serial entrepreneur who has also spent the better part of a decade advising and mentoring hundreds of Australian startups.

“Australia is late to the party, but the time has come for financial services to be disrupted and radically improved by a swarm of fintech entrepreneurs,” said Corbett-Jones. He added:

“The Hub doesn’t need to make a profit, but it does need to foster innovation, and that is what we will be measured on. We believe this space will be particularly attractive to anyone thinking about leaving a large, slow-moving employer – whether that’s a bank, an insurance company or a professional services firm – and launching their own startup.”

Rent is the most affordable for where it lies in the CBD at AU$625 a month full time, including meeting room bookings, internet and 24/7 access. Tenants can also choose part time plans at AU$420 for 10 days a month and AU$250 for five days a month.

There are no lock-in contracts – commitments are just month on month.  The hub aims to offer flexibility and elasticity as the size of a team shrinks or grows according to the stages of development.

Co-development

As well as co-working, Tyro Payments, an EFTPOS payments company, which processed AU$6.5 billion in transactions for 12,000 customers last year, will select one company per quarter and dedicate resources, banking access and expertise to co-develop open APIs.

Tyro is seeking to help others innovate and disrupt and thereby grow the fintech ecosystem, and will take no equity or fees in return. Companies interested in co-developing with Tyro should ideally work from the Hub during the project. Ideal candidates would have an experienced team, a product on the market and be well funded for their next phase.

Tyro CEO, Jost Stollmann,  the former German Shadow Minister of Economy and Technology and Founder and Chairman of Compunet, a company acquired by GE Capital, said:

“[W]e are very keen to see more companies do what we have done – powerfully disruptbanking in Australia.”

Tyro says the new facility, with room for 125 entrepreneurs, will also host accelerators, conferences, hackathons, meetups and seminars in a push to build and support Australia’s burgeoning technology companies in the financial services space. 

Startups wanting co-working desks can apply through the Fintech Hub website.


April 08, 2015 /George Samman
Comment

Bitcoin Price Analysis: Week of APR 5

April 05, 2015 by George Samman


Below will be a series of charts looking at the short, medium and long-term trends of bitcoin at the end of Q1. This will help provide us with key support and resistance levels to look at and see if the downward trend is anywhere near reversing.

Long-Term

The 1 year chart of bitcoin for the primary long term trend is bearish. Price has been on a continual decline.  The price remains below all 3 of its Exponential Moving Averages (EMAs).

However, there are some signs of improvement.  There is a positive divergence in the RSI versus the price.  A situation like this is one that should be watched but not acted on.  This is a potential sign of an upward price move. All indicators and most importantly the price are pointing down.

A MACD crossover has occurred below 0, which is also a positive sign. The problem is the price still remains in a downtrend so this is not a move to be acted on until price starts moving higher or the various indicators start rolling over (which would initiate a short). The 50 day EMA is acting as resistance as well.


I have also posted a long term chart using Ichimoku to try and get a better sense of where near term resistance is. It is confirming the 50 day EMA at around US$260-265 as a resistance level followed by US$275-280, which is the top of cloud as the next and harder resistance level. So far price is rejecting both of these levels.


Intermediate-Term

The intermediate term trend (6 months) is also bearish. Using Fibonacci Retracements drawn from the high in August of 2014, major areas of resistance can be found. The US$280 area comes into play again as a line of resistance that needs to be broken.

A trendline drawn from the lows has been broken. Broken support now becomes resistance so watch that line to see if price is ready to make a move higher. If US$240 doesn’t hold, the US$220 area could provide minor support, but U$200 would more likely be an area to watch for bigger support.  If it fails to hold, a retest of the lows (US$165-180) will certainly be the next area to watch for a change in the short and intermediate term trend.


Short-Term

Looking at the short term trend (mid-march high) using Fibonacci retracements, the price has rallied from the low at US$237 but is looking bearish again as the RSI has rolled over from an overbought position and is heading lower.

The Money Flow index is short term very overbought and should begin to correct soon.  The MACD had a positive crossover but is flattening out and should be watched for a rollover as well. In the short term, the .382 fibonacci lines at around US$261 has proven resistance as it has in the intermediate and long term trends. 

It’s time to find out if price is basing before a higher move or if it is going to make a move lower. Short term support can be found at US$251 and around US$240-237. Here, one can see the US$240 level is important and if it doesn’t hold, US$225 and US$208 are next support areas before US$200.  


All 3 price trends are looking bearish right now. Broken support becomes resistance so if bitcoinis to rally, there will be many resistance levels above which will need to be broken through (Fibonacci levels) along with the moving averages.

For now, looking at those levels isn’t important as the bitcoin price seems to be rangebound and looking for support. While the indicators are improving somewhat, this is a time to watch and not act. The charts are sending mixed messages. Wait for price to resolve itself one way or the other before making a move.

April 05, 2015 /George Samman
Comment

Blockchain Tech is the ‘Biggest Opportunity’ for Banks to Stay Relevant, Says New Report

March 27, 2015 by George Samman


Investment in financial-technology companies grew by 201% globally in 2014, according to a new report from Accenture. The consultancy firm named blockchain technology to be one of the keys that legacy banks need to “reimagine” themselves in order to keep up with innovation.

“Possibly the biggest opportunity from taking an open approach to innovation is in the area of the blockchain, the protocol that underpins the distributed architecture of thebitcoinCT r:  3 cryptocurrency.”

- Accenture Report

Fin-Tech Investment Boom

Investment in financial-technology (fintech) companies grew by 201% globally in 2014, compared to 63% growth in overall venture-capital investments, according to a new report from the consultancy firm Accenture titled The Future of Fintech and Banking: Digitally Disrupted or Reimagined.

Global investment in fintech tripled from US$4.05 billion in 2013 to US$12.2 billion in 2014 according to the report. The amount of money that went into first round investments grew by 48% alone.


Of the US$12.2 billion invested in fintech, most of it flowed to the US, however Europe experienced the highest level of growth, which increased by 215%. While it is well known that the UK and Ireland dominant fintech in Europe, their growth was slower compared to the Nordic countries, the Netherlands and Germany (see chart below). More importantly, Silicon Valley invested more than US$2 billion in fintech in 2014.

525d440b65df5b32184d94242fdd96d5.png


Disruption Ahead

While the report made it clear that the digital revolution in financial services is under way, the impact it will have on the current banking players remains to be seen. It reads:

“Digital disruption has the potential to shrink the role and relevance of today’s banks, and simultaneously help them create better, faster, cheaper services that make them an even more essential part of everyday life for institutions and individuals. To make the impact positive, banks are acknowledging that they need to shake themselves out of institutional complacency and recognize that merely navigating waves of regulation and waiting for interest rates to rise won’t protect them from obsolescence.”

The report interviewed 25 executives from the industry’s major banks. The biggest concerns were that the established players in financial services weren’t doing enough to keep up with the innovation coming from fintech startups and were very slow to deploy new technology in a timely manner while relying heavily on legacy technology.

The survey also revealed that 72% of these executives feel their bank has only a fragmented opportunistic strategy in dealing with innovation. What’s more interesting is that 20% believebanks will be completely disaggregated while another 16% believe banks will continue to lose market share and their financial services will continue to be delivered at much lower profit margins.


3 Keys to ‘Reimagine’ Banks

The Accenture report suggests that if banks are to remain relevant and compete, then there are 3 key behaviors that will enable them to reimagine and reinvent themselves in order to keep up with the blistering pace of innovation in the fintech space.

1) Act Open

Blockchain technology presents the biggest opportunity in this regard. “Possibly the biggest opportunity from taking an open approach to innovation is in the area of the blockchain, the protocol that underpins the distributed architecture of the bitcoin cryptocurrency,” reads the report. “It is early days for cryptocurrencies, and it is unclear what the long-term effects of their adoption will be on the financial services industry.”

It continued:

“However, it is clear that if established players are going to benefit from this revolutionary approach to finance, they will have to engage with a much wider range of technical specialists and developers outside their own organizations.”

2) Collaborate

The big challenge for established players is their organizational culture’s ability to adopt a collaborative approach with new innovators and startups.  In other words, learning how to work with third parties and align common interests.

3) Invest

Established financial services firms are building in house corporate venture arms to invest in fintech startups. American Express, BBVA, HSBC, Santander, and Sberbank have all developed corporate investment vehicles over the last four years, each with at least US$100 million to invest.

Conclusion

Fintech has emerged as a major component of venture capitalists portfolios and it looks poised to keep getting bigger. This bodes well for the disruption of traditional financial services and a new breed of more transparent, lower fee structure type companies to emerge in their wake asblockchain technology looks to be a major part of this process.

March 27, 2015 /George Samman
Comment

Europe Caps Payment Fees at 0.2% Undermining Bitcoin’s Appeal

March 26, 2015 by George Samman


The European Parliament has passed a deal to cap the fees at 0.2% that banks charge retailers to process payments in a move that could undermine one of bitcoin’sCT r:  3 main competitive advantages in the EU.

EU-wide rules end opaque card fees

The new cap on payment processing, which was passed by 621 votes to 26 with 29 abstentions, will apply to both cross border and domestic payments will result in lower costs for card users. 

According to European Parliament News, the European Commission stated the law will result in annual savings of €6 billion for businesses and €730 billion for consumers. This along with the recent launch of QE in Europe is an attempt to stimulate Europe’s ailing economy as these lower costs will help both retailers and shoppers.

This is a big effort towards transparency for an industry that has traditionally been the enemy of retailers and cardholders alike by passing down high fees that were often hidden, sometimes charging users 1- 3% on transactions.

Europe has traditionally been at the forefront of payment processing as a result of many nations sharing borders with different currencies pre-Euro. This has made Europe an innovator in the financial technology space and should be lauded for their attempt to bring lower fees and greater transparency to the entrenched card payment monopoly.

According to the announcement, the agreed fee cap is 0.2% of the transaction value for cross-border debit card transactions. Other measures include:

  • For domestic debit card transactions, at Parliament’s request, the same 0.2% cap will apply after a five-year transition period in which EU member states may cap fees at 0.2% of the “annual weighted average transaction value of all domestic transactions within the card scheme.”
  • For smaller domestic debit card transactions, member states may also set a maximum fixed fee of €0.05 per transaction, after the five-year transition period.
  • For credit card transactions, fees will be capped at 0.3% of transaction value and member states may set a lower fee cap for domestic credit card transactions.


E-commerce in Europe

CoinTelegraph spoke with Moe Levin, founder of the North American Bitcoin Conference and who until recently worked for BitPayCT r:  5 as Director of European Business Development. Levin told us that competition for the European payments market is heating up. He explained:

“[…] there are three main trends focusing on e-commerce:

1. Race to 1-click checkout. Who will make the most robust and reliable system to enable customers to checkout in one click. No more forms - just easy checkout experience;

2. Limiting the amount of information shared online. We’re seeing that as a huge trend where people, especially people under 40, are becoming more aware and concerned about sharing information with websites, and are seeking alternatives which can prevent them from being victims of identity theft or credit card fraud;

3. Alternative payment methods are becoming standardized. PayPal was (maybe still is) an alternative payment method, but is used by over 300 million users daily. Pay on delivery, pay with your mobile, pay with loyalty points, pay with bitcoin etc.”

“There are many many, MANY options in Europe,” he added. “So, looking at these three major trends in the system, I think that bitcoin can promise a solution to many of the pain-points in each trends evolution.”

Bad news for Bitcoin?

However, the latest move by the EU could prove to be bad news for cryptocurrency adoption on the continent This is because the new cap removes at least one important incentive for people to move from traditional payment methods in search of better alternatives like bitcoin, whose main selling point has been lower fees, particularly for merchants.

Bitcoin is frequently touted as having “near-zero” processing fees. Typically, bitcoin merchants in Europe incur lower fees by comparison, paying somewhere between 0 to 1% per transactiondepending on the payment processor or exchange.

One other point to consider is the inherent reward structure associated with traditional card use (points, frequent flyer miles, etc), which is still in the developing stages in the  cryptocurrency space, giving traditional payment networks yet another competitive advantage.

“I don’t think that this will make it harder for bitcoin to make inroads,” said Levin. “Bitcoin’s unique selling points are more than just cheap transactions for merchants.”

But while many don’t see this as a threat to cryptocurrency, which can still offer other benefits such as greater security, speed and privacy, the new EU-wide fee structure could still undermine bitcoin’s promise to users of significantly lower fees. 


Conclusion

Perhaps it is time for cryptocurrency enthusiasts to start thinking about how Bitcoin will truly compete and get consumers on board in developed countries where legacy players will seemingly do everything in their power to maintain a tight grip on the market.

Levin, however, remained undeterred and optimistic. “While transaction fees are a part of the equation, and certainly a pain in the ass, on a broader level, I think if we look at the trends,bitcoin will do very well.” He also added:

“There will always be hesitation, trepidation, concern about the new and unknown. The thing is - Europe has historically been used to many currencies, anyone older than 15 used to use different currencies daily. It is not as foreign a concept as people think but, maybe, there needs to still be the killer use-case of stabilizing the volatility.”


March 26, 2015 /George Samman
Comment
  • Newer
  • Older

Powered by Squarespace